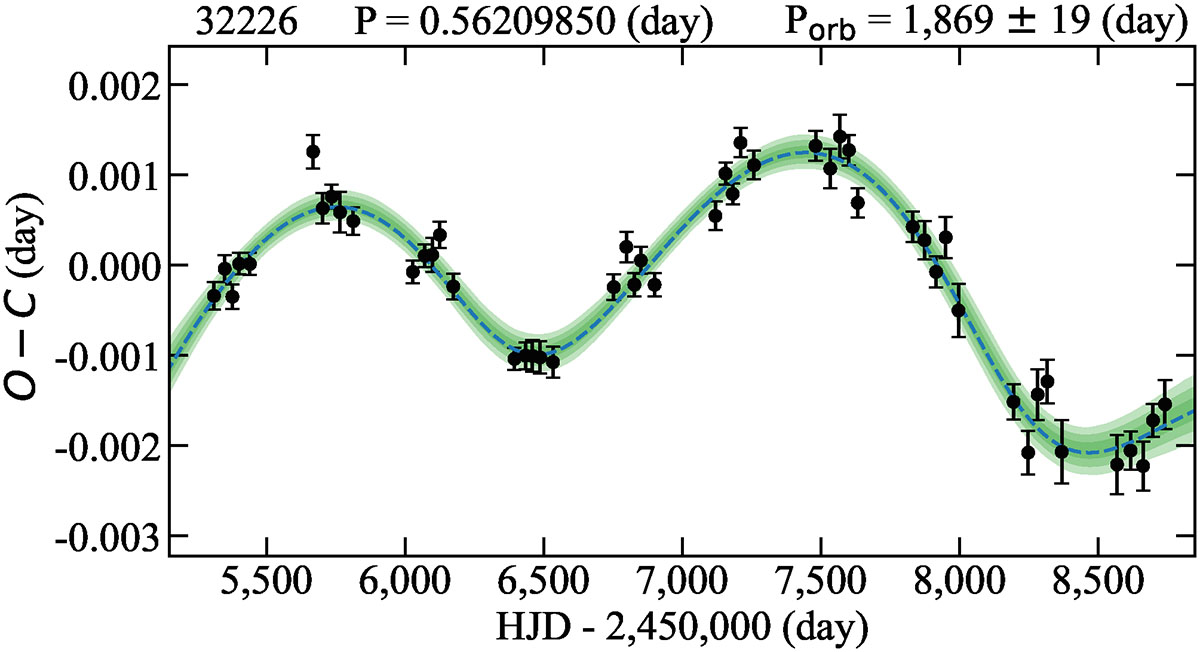
Fig. D.1.
Download original image
O − C diagram of OGLE-BLG-RRLYR-32226. Black points indicate the measured O − C values. The dashed line indicates the average solution from MCMC modeling (Hajdu et al. 2021). The shaded green regions denote the 1, 2, and 3σ credible intervals of the solutions. Above the panel, the OGLE ID, the pulsation period, and the orbital period are given.
Current usage metrics show cumulative count of Article Views (full-text article views including HTML views, PDF and ePub downloads, according to the available data) and Abstracts Views on Vision4Press platform.
Data correspond to usage on the plateform after 2015. The current usage metrics is available 48-96 hours after online publication and is updated daily on week days.
Initial download of the metrics may take a while.