Fig. 11
Download original image
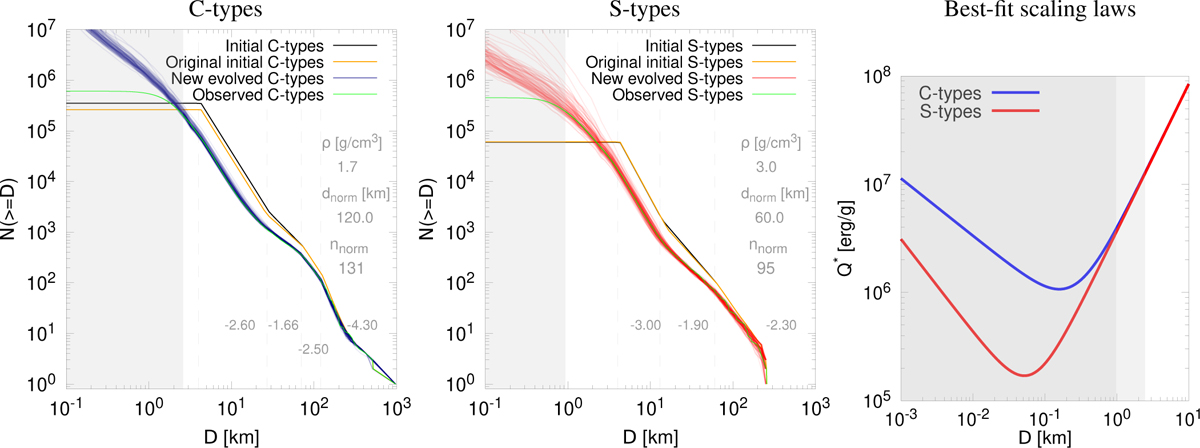
Same as Fig. 6 for C- and S-types with a modified scaling law (“idea 2”). After this modification, both synthetic SFDs agree very well with the observed SFDs above the observational limits, and almost none “undershoots” the observed SFDs below the limits. The respective pseudo χ2 was 50.0. For reference, we also plot the corresponding best-fit scaling laws for the C- and S-types (Eqs. (3) and (4)) with the gray areas corresponding to the range of sizes below the observational limits.
Current usage metrics show cumulative count of Article Views (full-text article views including HTML views, PDF and ePub downloads, according to the available data) and Abstracts Views on Vision4Press platform.
Data correspond to usage on the plateform after 2015. The current usage metrics is available 48-96 hours after online publication and is updated daily on week days.
Initial download of the metrics may take a while.