Fig. 12
Download original image
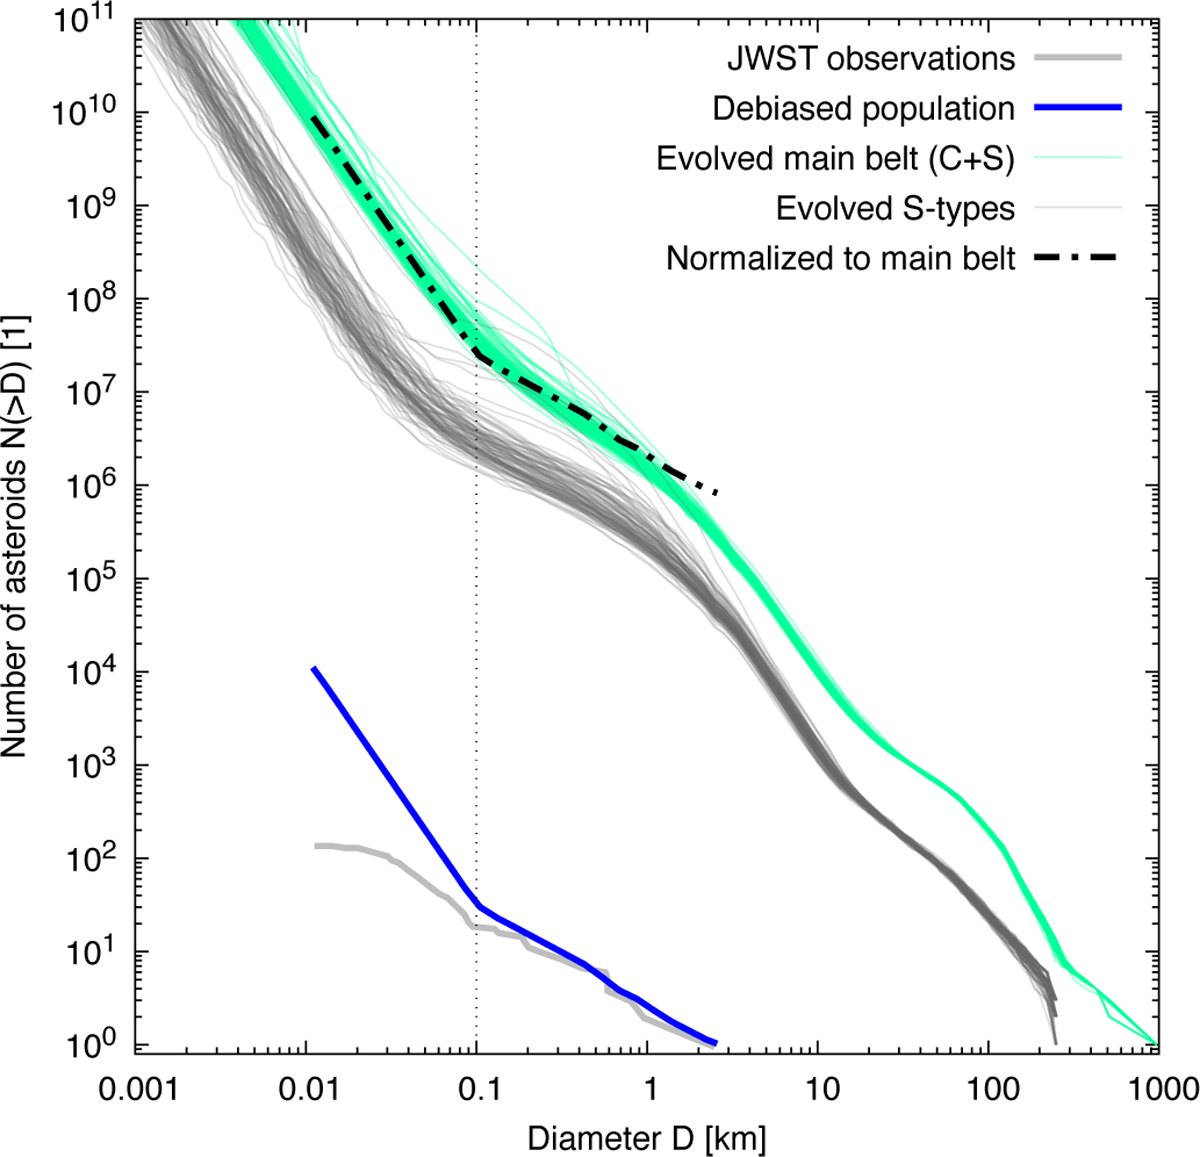
Comparison of our collisional model with JWST observations (Burdanov et al. 2025). The SFD for the sum of C- and S-types (green) exhibits a change of slope from shallow to steep (q = −2.66) at approximately 100 m, in agreement with the observed (gray), debiased (blue), and scaled (dash-dotted) SFD from JWST. For reference, we also plot the synthetic SFD of S-types (gray); these S-types are about five times less numerous than C-types and exhibit a change of slope at a smaller size (∼50m).
Current usage metrics show cumulative count of Article Views (full-text article views including HTML views, PDF and ePub downloads, according to the available data) and Abstracts Views on Vision4Press platform.
Data correspond to usage on the plateform after 2015. The current usage metrics is available 48-96 hours after online publication and is updated daily on week days.
Initial download of the metrics may take a while.