Fig. 3
Download original image
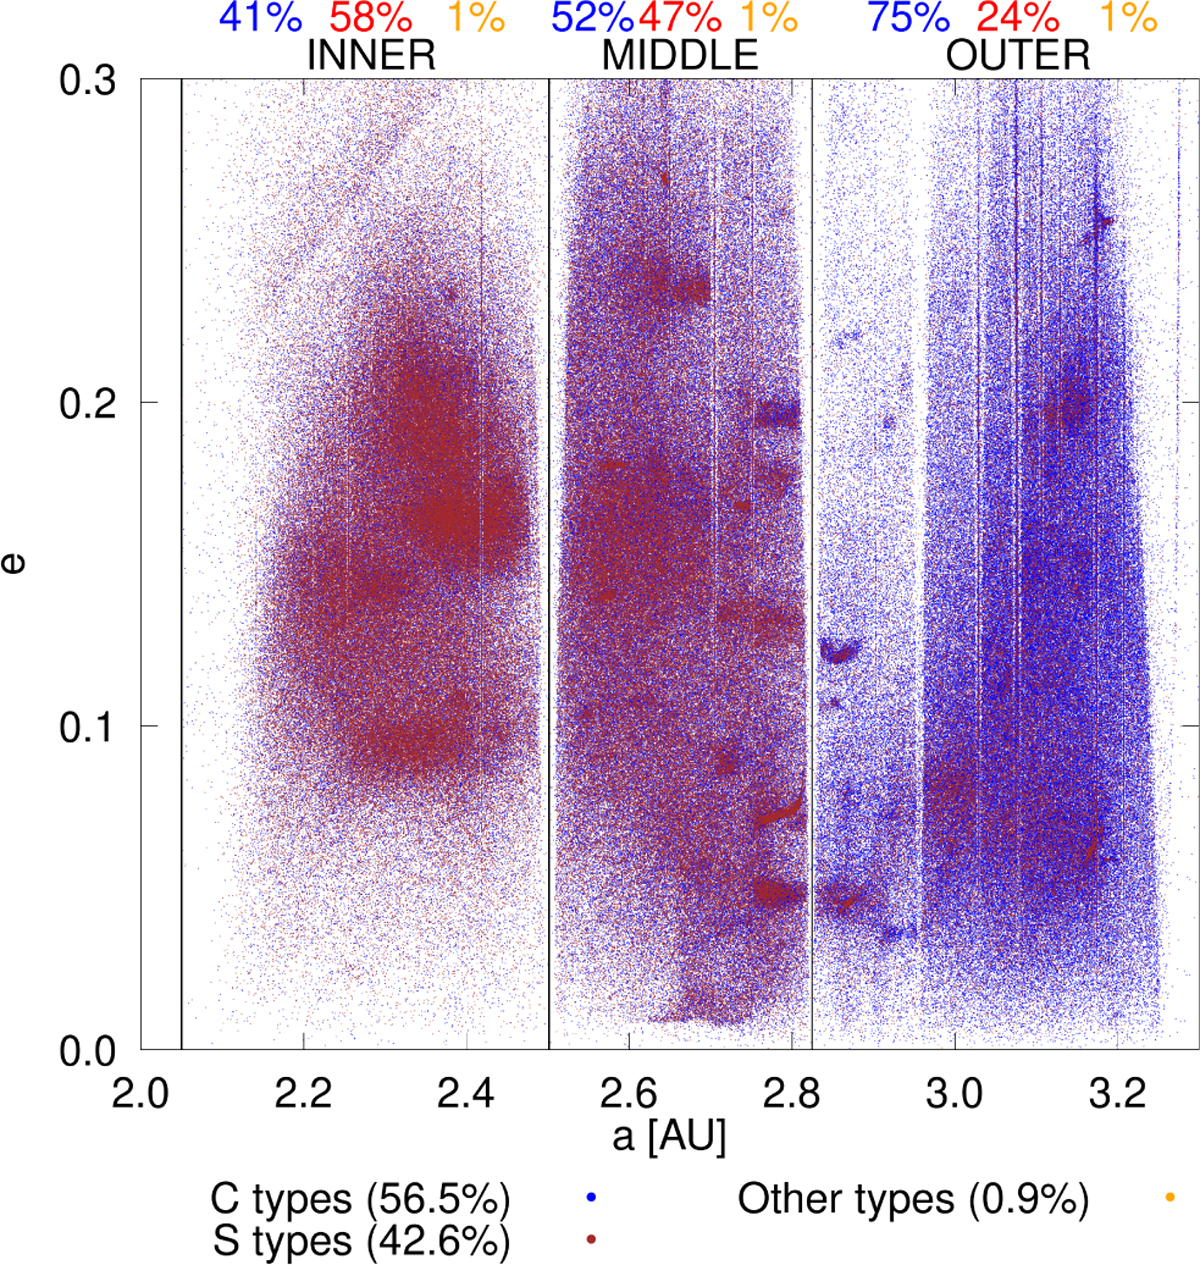
Scatter plot of eccentricity vs. semimajor axis (both proper or osculating) for all resulted 601 213 C-, 453 998 S-, and 9823 other types across different parts of the MB (inner, middle, and outer) separated by vertical black lines. Above the plot are the relative numbers of each taxonomy (blue for C-, red for S-, and orange for other types) within the specific parts of the MB.
Current usage metrics show cumulative count of Article Views (full-text article views including HTML views, PDF and ePub downloads, according to the available data) and Abstracts Views on Vision4Press platform.
Data correspond to usage on the plateform after 2015. The current usage metrics is available 48-96 hours after online publication and is updated daily on week days.
Initial download of the metrics may take a while.