Fig. 6
Download original image
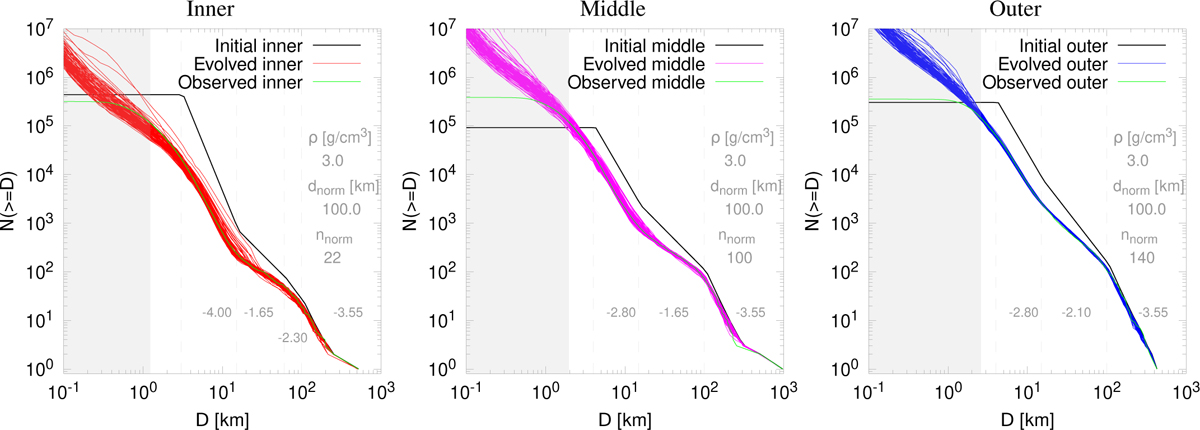
Initial SFD (black), 100 evolved SFDs of the inner (red), middle (pink), and outer (blue) parts, and their respective observed SFD (green). The vertical dashed gray lines represent size ranges where the initial SFD was approximated by a different power law, i.e., a different slope. For the inner part, for example, the slopes are −3.55 above 100 km, −2.30 between 100 and 60 km, −1.65 between 60 and 15 km, and −4.00 between 15 and 3 km. The last slope below 3 km was set to zero, i.e., a constant cumulative SFD (“no tail”). Individual slopes are shown in gray within the panels at the respective size ranges. Density ρ, normalization size dnorm, and the normalization number nnorm for each part are shown on the right side of the respective panel. The gray areas correspond to the size ranges below the observational limits. The problem in the inner part is that most evolved SFDs lie below the observed SFD below D ~ 3 km.
Current usage metrics show cumulative count of Article Views (full-text article views including HTML views, PDF and ePub downloads, according to the available data) and Abstracts Views on Vision4Press platform.
Data correspond to usage on the plateform after 2015. The current usage metrics is available 48-96 hours after online publication and is updated daily on week days.
Initial download of the metrics may take a while.