Fig. 9
Download original image
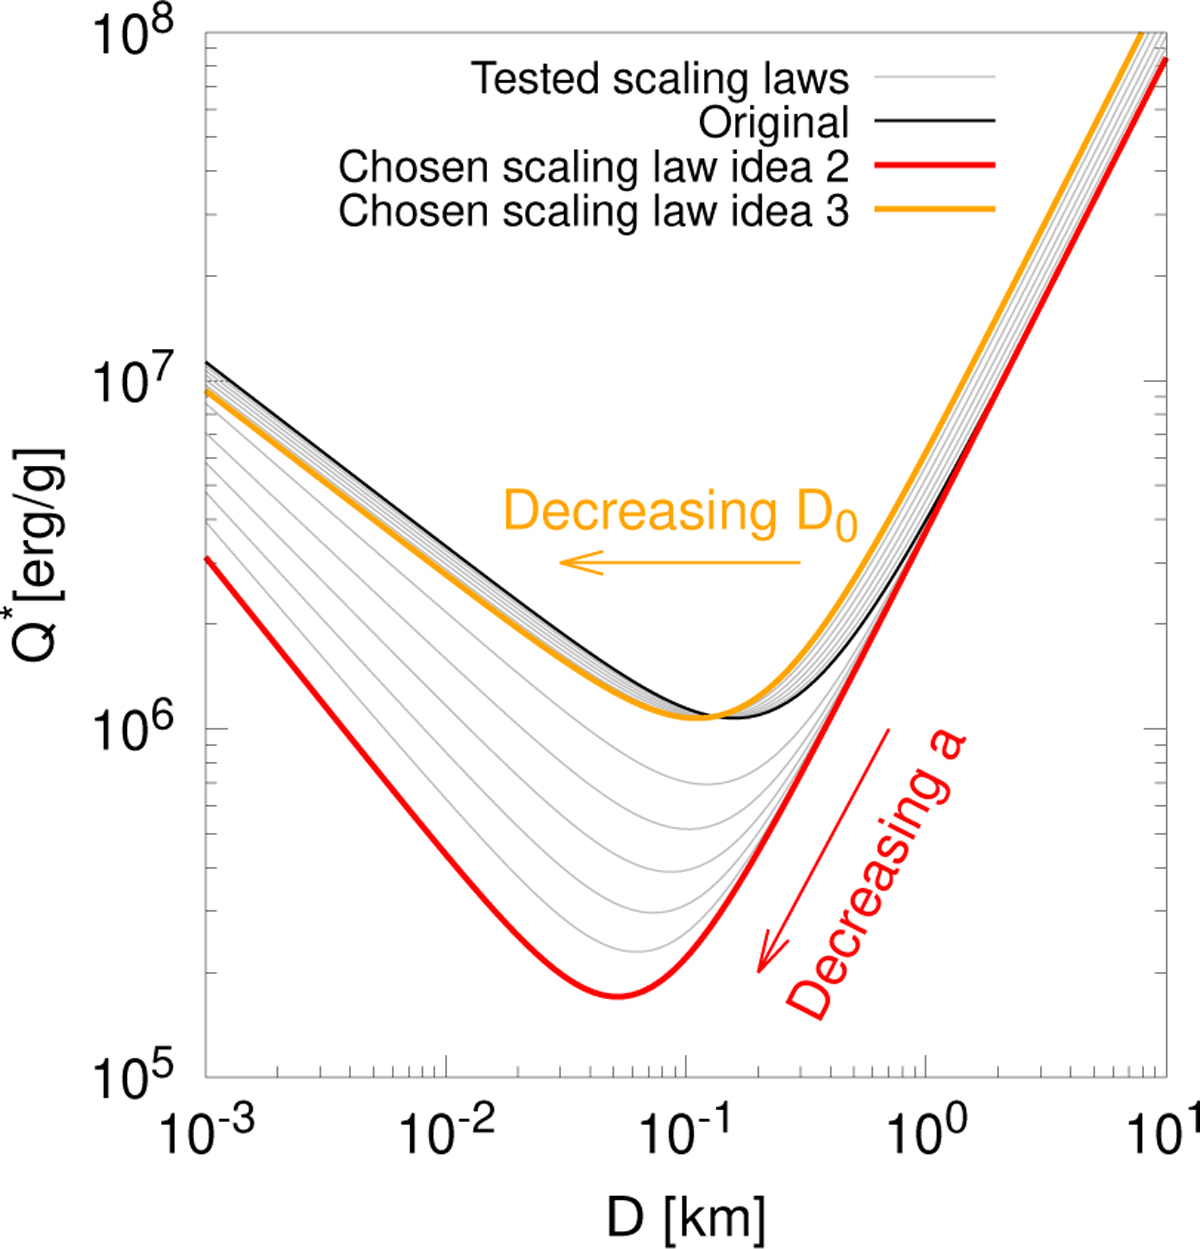
Twelve scaling laws (gray) tested for the inner belt, compared to the original (black) from Sect. 3.5. Those, which substantially increased the evolved SFDs below the observational limit, are shown in red and orange. The directions of scaling law minimum changes for decreasing a and D0 are shown by red and orange arrows, respectively.
Current usage metrics show cumulative count of Article Views (full-text article views including HTML views, PDF and ePub downloads, according to the available data) and Abstracts Views on Vision4Press platform.
Data correspond to usage on the plateform after 2015. The current usage metrics is available 48-96 hours after online publication and is updated daily on week days.
Initial download of the metrics may take a while.