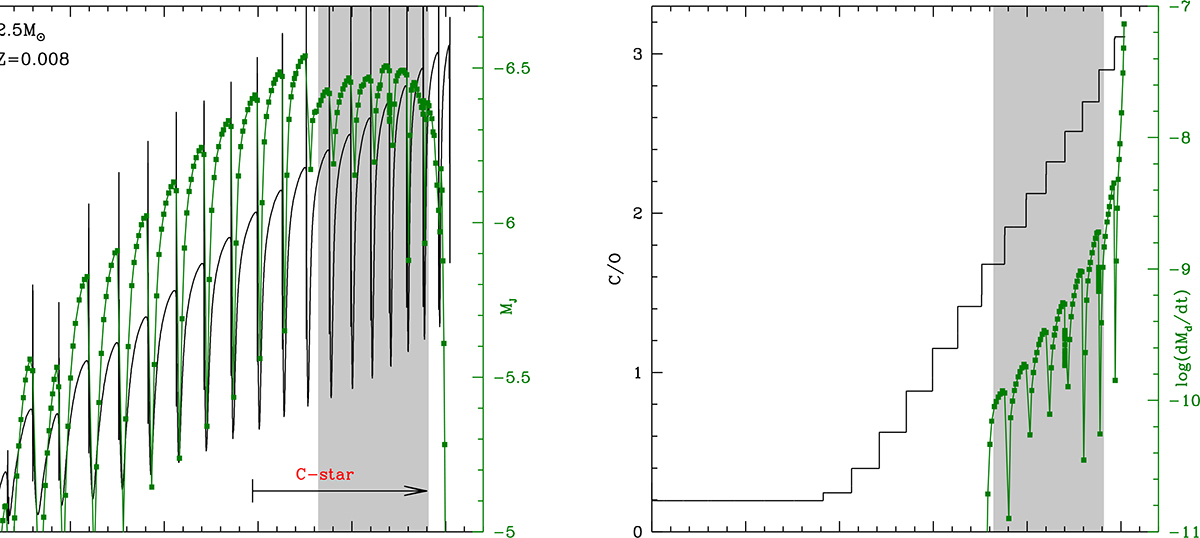
Fig. 1.
Download original image
Left: Time variation of the luminosity (black line, scale on the left) and the J magnitude (green, scale on the right) of a model star of initial mass 2.5 M⊙ and metallicity Z = 0.008. The black arrow indicates the start of the C-star phase. Right: Time evolution of the surface C/O and the DPR of the same model star shown in the left panel. Times are counted since the beginning of the TP-AGB phase. Grey-shaded regions indicate the phase during which 1.5 < J − K < 2 mag.
Current usage metrics show cumulative count of Article Views (full-text article views including HTML views, PDF and ePub downloads, according to the available data) and Abstracts Views on Vision4Press platform.
Data correspond to usage on the plateform after 2015. The current usage metrics is available 48-96 hours after online publication and is updated daily on week days.
Initial download of the metrics may take a while.