| Issue |
A&A
Volume 707, March 2026
|
|
|---|---|---|
| Article Number | A384 | |
| Number of page(s) | 12 | |
| Section | Stellar structure and evolution | |
| DOI | https://doi.org/10.1051/0004-6361/202557743 | |
| Published online | 20 March 2026 | |
An analysis of the JAGB method from the perspective of the asymptotic giant branch evolution
1
Dipartimento di Matematica e Fisica, Università degli Studi Roma Tre, Via della Vasca Navale 84, 00100, Roma, Italy
2
INAF, Observatory of Rome, Via Frascati 33, 00077, Monte Porzio Catone (RM), Italy
3
ASI-Space Science Data Center, Via del Politecnico, I-00133, Rome, Italy
⋆ Corresponding author: This email address is being protected from spambots. You need JavaScript enabled to view it.
Received:
17
October
2025
Accepted:
23
January
2026
Abstract
Context. The JAGB method has been proposed over the last years as a possible distance indicator for the galaxies in the Local Group and possibly beyond. The nature of the stars populating the J region, as well as the conditions of the star formation history and the structural properties of the galaxies for the straight application of this method, still need to be investigated.
Aims. We studied the populations of the J region of the colour-magnitude (J − K, J) plane of the Large and Small Magellanic Clouds (LMC and SMC, respectively) to relate the shape of the J luminosity function (JLF) to the details of the formation histories of the two galaxies. Our aim is to try and distinguish the general aspects of the JLF to those more sensitive to the stellar population of the specific galaxy considered.
Methods. We used a population synthesis approach, based on the combined results from stellar evolution and dust formation modelling, to find the expected distribution of the stars within the J region. We then compared the outcome with results derived from observations of LMC and SMC stars. Some physical assumptions, mostly related to the modelling of the red giant branch (RGB) and asymptotic giant branch (AGB) phases of stars, were tuned until a satisfactory agreement between the expectations from synthetic modelling and the observational evidence was reached.
Results. The sources observed within the J region were characterised as stars that recently reached the C-star stage and have not yet accumulated the extremely large amounts of carbon required to make the evolutionary track to evolve off the J region. Generally speaking, 2 − 3 M⊙ stars stay within the J region longer, while lower mass objects evolve there for at most a couple of inter-pulse phases. The analysis of the JLF of the LMC, peaking at the J magnitudes expected for these stars, confirms this understanding. In the SMC, the distribution of the J fluxes is shifted to higher J magnitudes when compared to the LMC, which we interpret as the signature of a generally older population, with lower mass progenitors.
Key words: stars: AGB and post-AGB / stars: evolution / stars: luminosity function / mass function / stars: mass-loss / dust, extinction / distance scale
© The Authors 2026
 Open Access article, published by EDP Sciences, under the terms of the Creative Commons Attribution License (https://creativecommons.org/licenses/by/4.0), which permits unrestricted use, distribution, and reproduction in any medium, provided the original work is properly cited.
This article is published in open access under the Subscribe to Open model. This email address is being protected from spambots. You need JavaScript enabled to view it. to support open access publication.
1. Introduction
Over recent decades, more attention has been devoted to the asymptotic giant branch (AGB), the evolutionary phase experienced by all stars with an initial mass between 1 and 8 M⊙, which begins after the consumption of central helium and extends until the external envelope of the star is lost. AGB stars are often split into different sub-classes, such as those that have not yet experienced any thermal pulse (early-AGB), those enriched in carbon at the surface regions (carbon stars), or those surrounded by dust. A summary of the distinctions among AGB stars can be found in Weinberg & Nikolaev (2001). During the AGB phase, stars lose their envelopes, enriching the surrounding medium with chemically processed gas (Kobayashi et al. 2020; Romano 2022). These ejecta play a key role in the production of carbon and nitrogen (Vincenzo et al. 2016), as well as in shaping the chemical patterns of the Local Group star-forming regions and, possibly, in the origin of multiple stellar populations in globular clusters (Ventura et al. 2001).
AGB stars are also among the most efficient dust producers, as their circumstellar envelopes provide the ideal conditions for grain condensation (Gail & Sedlmayr 1985). Together with supernovae, they dominate the cosmic dust budget, although their relative contributions remain debated (Schneider & Maiolino 2023). Understanding AGB dust formation is thus essential both for computing stellar dust yields and for interpreting infrared (IR) observations, given the reprocessing of stellar radiation by circumstellar dust.
Modern AGB models now include self-consistent treatments of dust formation in stellar winds (Ventura et al. 2012, 2014; Nanni et al. 2013, 2014), following the approach of the Heidelberg group (Ferrarotti & Gail 2001, 2002, 2006), which predict dust composition, quantity and production rates. These models have been widely applied to estimate the AGB dust budget in nearby galaxies (Schneider et al. 2014) and to interpret the evolved stellar populations in the Magellanic Clouds (MCs) and other Local Group (LG) systems (Dell’Agli et al. 2014a; Dell’Agli et al. 2015a; Dell’Agli et al. 2015b; Nanni et al. 2016, 2019; Dell’Agli et al. 2016; Dell’Agli et al. 2018; Dell’Agli et al. 2019; Gavetti et al. 2025).
The capability to investigate the evolved stellar populations of galaxies is becoming increasingly relevant in the James Webb Space Telescope (JWST) era. Due to its unprecedented IR sensitivity, JWST enables the detection of resolved stellar populations in galaxies well beyond the LG and provides an exceptional tool for studying AGB stars (Correnti et al. 2025; Bortolini et al. 2025). For a significant fraction of these systems, AGB stars represent important tracers for reconstructing their star formation histories (SFHs), due to their age sensitivity in the near infrared (NIR) (Lee et al. 2024b; Bortolini et al. 2024).
A further motivation to study the structure, evolution and dust formation of AGB stars is their potential use as distance indicators. This idea originates from Nikolaev & Weinberg (2000), who identified a region in the (J − Ks, Ks) plane of the LMC (later called the “J region”) dominated by carbon stars and proposed them as standard candles to trace the 3D structure of the LMC. Subsequent works (Madore & Freedman 2020; Freedman & Madore 2020) extended this approach to nearby galaxies, coining the JAGB method, and found that stars within 1.3 < J − K < 2.0 mag have a mean of MJ ∼ −6.20 mag. However, Ripoche et al. (2020) reported systematic differences between the LMC, SMC and Milky Way, suggesting a possible metallicity dependence. More recently, Magnus et al. (2024) refined the calibration using Gaia data, selecting a clean carbon star sample within 1.5 < J − K < 2.0 mag and a 1.2 mag wide J window. They confirmed a mean MJ of ∼ − 6.25 mag for the LMC and ∼ − 6.18 mag for the SMC.
The results discussed above highlight the need for a precise calibration of the JAGB method to enable its use for measuring distances to more distant galaxies. Indeed, JAGB stars are, on average, significantly brighter than the tip of the red giant branch (TRGB), allowing for distance determinations well beyond the TRGB limit. Compared to Cepheids, the JAGB method requires only a single epoch of observations and can be applied to galaxies hosting stellar populations aged between ∼200 Myr and 1 Gyr, whereas Cepheids are confined to the disks of spiral and irregular systems. These advantages, together with the advent of JWST, have motivated the community to apply this technique to an increasing number of galaxies to refine the determination of the Hubble constant (Lee et al. 2024a; Li et al. 2025; Freedman et al. 2025).
Against this background, we decided to start a new research project, designed to understand if (and under which conditions) the JAGB method can be safely used to determine the distance of galaxies, based on the study of the evolution of the positions of the stars on the colour-magnitude diagram (CMD), as they evolve through the AGB. To this aim, we considered AGB models across a range of masses and chemical compositions, where dust formation is taken into account, to allow for the variation of the spectral energy distribution (SED) to be followed; then focusing on the determination of the IR colours and magnitudes. We concentrated on the evolutionary phases during which the stars evolve across the J region, defined according to the recommendations of Magnus et al. (2024), to clarify the following points: (a) which stars enter the J region; (b) how long the stars remain within the J region; (c) what the chemical composition, the dust mineralogy and the dust production rate (DPR) of the stars during these evolutionary phases are. Answering these questions is the sine qua non condition for a general application of the J method to measuring the distances of galaxies.
In this first work, we describe the main factors affecting the crossing and the amount of time AGB stars remain in the J region in relation to the mass and the formation epoch of the stars. We started by analysing the LMC and the SMC, since for these two galaxies both the SFH and the age-metallicity relationship (AMR) are robustly known, which simplifies the comparison between theoretical modelling and observations. We compare the J luminosity function of the stars in the J region of the CMDs of the LMC and SMC published in Magnus et al. (2024), with results based on a population synthesis approach that relies on the modelling of the AGB evolution and the dust formation process. The goal of the present analysis, other than confirming the possibility of reproducing the observed luminosity functions, is the characterisation of the LMC and SMC stars currently populating the J region, in relation to the mass, chemical composition and formation epoch of the progenitors.
This work is to be considered as a first step towards the comprehension of the conditions under which the J method can be reliably applied as a distance indicator. This is an argument that is examined in depth in the following investigations on this topic, where all the galaxies for which the JLF has been derived are considered, along with a general overview of the results obtained with various SFH and AMR scenarios.
The structure of the paper is as follows: the numerical and physical ingredients used to model the AGB evolution and the dust formation process, along with the techniques adopted in the population synthesis approach, are described in Section 2. The main physical and chemical properties of AGB stars, as well as the conditions and timing of their crossing the J region of the colour-magnitude (J − K, J) plane, are discussed in Section 3. Section 4 is devoted to the application of the population synthesis approach to studying the stellar population of the J region of the LMC, as well as to testing the possibility of reproducing the results reported in Magnus et al. (2024). A comparative analysis between the populations of the J regions of the LMC and SMC, in relation to the difference in the SFH of the two galaxies, is addressed in Section 5. Finally, our conclusions are given in Section 6.
2. Physical and numerical input
The analysis presented in this work is based on a comparison between the observed J luminosity function of the stars populating the J region of the LMC and the SMC, selected on the basis of the indications given in Magnus et al. (2024), with the results obtained by a population synthesis approach. For the purpose of the latter, we ran numerical simulations, based on the SFH and the AMR of the galaxy considered, to calculate the number of stars currently evolving through the JAGB, along with the mass and metallicity of the progenitors. For the LMC, we adopted the SFH derived by Mazzi et al. (2021), combined with the AMR by Carrera et al. (2008); whereas for the SMC, we followed the SFH and the AMR given by Rubele et al. (2018).
Finding the synthetic distribution of the stars across the CMD requires knowledge of the evolutionary tracks of the stars evolving across the AGB and the time variation of the position along the track. This can be obtained by modelling the evolution of stars of different masses and metallicities, combined with the description of the dust formation that is required to account for the modification of the SED due to the reprocessing of the radiation by dust grains. For this work, we used extant evolutionary sequences previously published by our group, namely, those of metallicities Z = 0.001 (Ventura et al. 2014), Z = 0.004 and Z = 0.008 (Marini et al. 2021). The above computations were recently extended until the start of the white dwarf cooling, as described in Kamath et al. (2023). For the stars of initial mass M ≤ 2 M⊙, the computations were first evolved from the pre-MS through the core hydrogen-burning and the red giant branch (RGB) phase, until the TRGB, when the helium flash takes place. The simulations were then restarted from the quiescent core helium-burning phase, based on the core masses reached at the TRGB. We observed that these stars lose a significant fraction of the mass of their envelope during the evolution along the RGB; thus, the mass at which they undergo core helium-burning is lower than the initial mass. We assumed that all the stars of mass below 1.5 M⊙ lose 0.2 M⊙ during the ascent along the RGB. In the following, we refer to the mass of these stars at the start of the core helium-burning phase, keeping in mind that the mass of the progenitors was 0.2 M⊙ higher. Next, we tested how this choice affects the results obtained.
Dust formation in the wind is described by following the formalism proposed by Ferrarotti & Gail (2006), in the modality extensively described in Ventura et al. (2012). The application of the modelling of dust formation to the results from stellar evolution leads to the determination of the variation in the dust composition and the DPR of the stars as they evolve along the AGB. The final step to build the evolutionary tracks of the stars is the determination of the variation of the SED. This, in turn, is used to find the colours and magnitudes in the selected filters, via convolution of the SED with the corresponding transmission curves. This is done by means of the DUSTY code (Nenkova et al. 1999), which uses as input the results from the modelling of dust formation. This work is based on the sequence of synthetic SEDs recently used by Gavetti et al. (2025).
The evolutionary sequences of the stars of different initial mass and metallicity are available at the CDS. For M > 2 M⊙ stars, the masses refer to the initial values, characterising the stars during the formation process; for the lower-mass counterparts, the masses were taken at the start of the core helium-burning phase. For each model star, we made note of the variation during the AGB phase of the most relevant physical quantities and of the JHK magnitudes.
3. AGB evolution across the J region
3.1. The main physical aspects of AGB evolution
The evolution of the AGB is driven by the gradual growth of the core mass (MC), fuelled by the action of the hydrogen-burning shell, which (for the majority of the AGB lifetime) is the sole nuclearly active source in the star (Karakas & Lattanzio 2014). Periodically, helium ignition occurs in a thin shell lying above the degenerate core made up of carbon; given that these nuclear episodes occur in conditions of thermal instability (Schwarzschild & Härm 1965), the common terminology used to refer to them is thermal pulse (TP). The rise in the core mass favours the increase in the luminosity, given the approximately linear relationship connecting these two quantities, originally derived in the work of Paczyński (1970), which all AGB stars obey (with some exceptions discussed below). This behaviour can be seen in the left panels of Figs. 1 and 2, which report the AGB evolution of model stars of initial mass 2.5 M⊙ and 4 M⊙, respectively. In the 2.5 M⊙ case, the luminosity increases during the AGB phase from ∼2 × 10³ L⊙ to ∼9 × 10³ L⊙, while the core mass changes from 0.52 M⊙ to 0.62 M⊙. As for the 4 M⊙ model star, the luminosity varies from ∼1.2 × 10⁴ L⊙ to ∼3.5 × 10⁴ L⊙, with the core mass increasing from 0.82 M⊙ at the occurrence of the first TP, to 0.88 M⊙, at the end of the AGB.
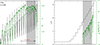 |
Fig. 1. Left: Time variation of the luminosity (black line, scale on the left) and the J magnitude (green, scale on the right) of a model star of initial mass 2.5 M⊙ and metallicity Z = 0.008. The black arrow indicates the start of the C-star phase. Right: Time evolution of the surface C/O and the DPR of the same model star shown in the left panel. Times are counted since the beginning of the TP-AGB phase. Grey-shaded regions indicate the phase during which 1.5 < J − K < 2 mag. |
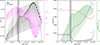 |
Fig. 2. Left: Time variation of the luminosity (black line, scale on the left) and the J magnitude (magenta, scale on the right) of a model star of initial mass 4 M⊙ and metallicity Z = 0.008. Right: Time evolution of the surface carbon (black line), nitrogen (blue), oxygen (red) (black scale on the right) and the DPR (green scale on the right) of the same model star shown in the left panel. Times are counted since the beginning of the TP-AGB phase. Grey-shaded regions indicate the phase during which 1.5 < J − K < 2 mag. |
3.2. The surface chemical composition of AGB stars
The surface chemical composition of AGB stars can be altered by two mechanisms, which leave behind different chemical imprints. The third dredge-up (TDU) takes place during the evolutionary phases, following the ignition of each TP, when the hydrogen-burning shell is temporarily extinguished and the surface convection penetrates inwards until reaching regions of the star previously processed by helium nucleosynthesis (Iben 1974). The primary effect of the TDU is the increase in the surface abundance of carbon, which can lead to the formation of a carbon star. The alternative mechanism capable of changing the surface chemical composition of AGB stars is hot bottom burning (HBB), which consists of the activation of proton capture nucleosynthesis at the base of the convective envelope, when the temperatures in those regions of the star reach (and exceed) 30 MK (Sackmann & Boothroyd 1992). The ignition of HBB leads to a swift increase in the stellar luminosity (Ventura & D’Antona 2005), with significant deviations from the linear MC − L trend reported by Paczyński (1970). The impact of HBB on the behaviour of the luminosity can be seen in the left panel of Fig. 2, which shows that the luminosity of the 4 M⊙ model star first increases, until ∼3.5 × 10⁴ L⊙, then decreases during the final evolutionary phases, when HBB is progressively turned off by the gradual loss of the envelope. This behaviour, typical of the stars experiencing HBB, is not seen in the time variation of the luminosity of the 2.5 M⊙ model star shown in the left panel of Fig. 1; this is because the ignition of HBB requires core masses in excess of 0.8 M⊙ (Ventura et al. 2013), which are reached only by stars of an initial mass above ∼3 M⊙. On the chemical side, HBB changes the surface chemistry of the star according to the equilibria of the activated p-capture nucleosynthesis. While the degree of the nucleosynthesis experienced is extremely sensitive to the metallicity of the star (Dell’Agli et al. 2018), the depletion of surface carbon and the parallel synthesis of nitrogen take place in all cases when HBB is activated. The main effects of TDU and HBB can be seen in the right panels of Figs. 1 and 2. In the former, we note the gradual rise in the surface C/O ratio, which (under the influence of repeated TDU episodes) grows until a final value around 3. After a duration of about half the AGB lifetime, the surface carbon exceeds oxygen and the star reaches the C-star stage (this is indicated by the horizontal arrow in the lower part of the figure). In the right panel of Fig. 2, we see the effects of HBB in the decrease in the surface carbon and the rise in the nitrogen abundance, beginning ∼105 yr after the start of the AGB phase. During the very final evolutionary phases, the surface carbon increases under the action of TDU, while HBB is turned off.
3.3. The position of AGB stars on the (J − K, K) plane
Ventura et al. (2022) divided AGB stars in three different groups, according to the modality with which the surface chemistry changes and, consequently, on the chemistry and the quantity of dust produced in their wind, and subsequently on the evolution of the SED: (I) M < 1 M⊙ stars, whose chemical composition remains substantially unchanged during AGB evolution, because the core mass is too low for the ignition of HBB and they lose the external mantle (of a few tenths of solar masses) before repeated TDU events can raise the surface carbon significantly; (II) 1 M⊙ < M < 3 M⊙ stars, which become carbon stars, under the effects of TDU; and (III) massive AGBs descending from M > 3 M⊙ progenitors, whose surface chemistry mainly reflects the effects of HBB1.
Group I is not of interest for the purposes of the present investigation, because they evolve on the blue side of the CMD, never entering the J region of the plane. The evolution of the stars belonging to group II is characterised by the gradual increase in the surface carbon, which proceeds until the near-complete loss of the envelope. A prototype of the evolution of these objects is shown in Fig. 1. The variation of the DPR shown in the right panel of Fig. 1 indicates that dust production is negligible during the O-rich phase, while it becomes higher and higher as carbon is accumulated in the surface regions, until it reaches values of the order of 10−7 M⊙/yr during the final phase of the AGB evolution. The increase in the surface carbon enhances the efficiency of the dust production mechanism for two reasons, related to the thermal reaction of the external regions of the star to the transition from the O-rich to the C-star phase and to the higher number of C-bearing molecules in the external mantle. The first motivation is that the formation of carbon stars was shown to trigger the enhancement of the surface molecular opacities (Marigo 2002), thus leading to the expansion and cooling of the external layers of the star (Ventura & Marigo 2009, 2010) and lower surface gravities, followed by higher mass loss rates. These conditions turn out to be extremely favourable to the condensation of gaseous molecules into solid grains because the vaporisation process is partly inhibited by the low temperatures and the high densities make a higher number of gaseous molecules available to condense into dust grains. A further reason why the higher surface carbon content favours dust production is that the amount of carbon dust formed depends on the carbon excess with respect to oxygen (Ferrarotti & Gail 2006) and, thus, the higher the number of molecules available to form carbon dust is higher the higher the surface carbon. The formation of carbon dust favours the gradual shift of the SED towards the near-IR and then the mid-IR spectral region.
In Fig. 3, we show the evolutionary tracks of stars of different initial mass and metallicity Z = 8 × 10⁻³ in the CMD. The minimum mass considered in the plot is 1.1 M⊙ (which corresponds to a progenitor’s mass of 1.3 M⊙) because the tracks of lower mass stars develop along the blue side of the plane, never turning to the red; thus, it does not cross into the J region (identified by the grey box in the figure). All the evolutionary tracks reported in Fig. 3 correspond to stars belonging to the group II, but the cyan line, corresponding to the 4 M⊙ model star. The tracks evolve to the red side of the plane and enter the J region soon after becoming carbon stars.
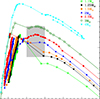 |
Fig. 3. Evolutionary tracks of model stars of metallicity Z = 8 × 10⁻³ on the (J − K, J) colour-magnitude diagram. The different points along the tracks refer to some selected evolutionary stages taken during the AGB phase, chosen in order to well represent the excursion of the tracks on the observational plane. The grey shaded region indicate the box chosen by Magnus et al. (2024) for the J region. The masses given for M < 1.5 M⊙ refer to the values attained at the TRGB. |
In the left panel of Fig. 1, we note the ∼0.15 mag depression in MJ taking place shortly after the transition to a C-star, despite the fact that the luminosity of the star increases during the same period: this indicates that the peak of the SED progressively moves to the λ > 1 μm spectral region. In the specific 2.5 M⊙ case discussed here the star evolves within the J region of the CMD with 1.5 < J − K < 2.0 mag, where it stays for ∼6 × 10⁴ yr, over six inter-pulse phases following the transition from an M-type to a C-type star. The evolutionary track of the 2.5 M⊙ model star discussed here is shown in red in Fig. 3. During the very final AGB phases, when the surface C/O exceeds 2.5, the formation of notable quantities of carbon dust favours a significant reprocessing of the radiation released from the photosphere of the star, while the shift of the SED to the mid-IR spectral region. Under these conditions, the flux in the J band is almost negligible, so that the evolutionary track moves to the lower far red side of the CMD. We see in Fig. 3 that this behaviour is common to all the stars that become carbon stars, which populate the K region of plane during the final AGB phases, according to the nomenclature adopted by Weinberg & Nikolaev (2001) to identify carbon dust-enshrouded AGB stars on the observational plane. The values of MJ attained by the star during these advanced evolutionary phases derived from the synthetic modelling are to be taken with some caution; however, this is not an issue for the analysis done here, because these stars do not fall into the J region of the CMD.
These results indicate that 1 − 3 M⊙ stars belonging to the group II (introduced earlier in this section) evolve into the J region of the CMD when they undergo a transition phase, which starts after becoming carbon stars. The beginning of this phase occurs when the carbonaceous dust in the wind forms with sufficiently high rates, so that the SED is shifted towards the near-IR, and J − K > 1.5 mag. The conclusion of this transition time takes place when the excess of carbon with respect to oxygen becomes so high that the dust forms in the wind in quantities large enough to reach the J − K > 2.0 mag condition. The stars in the J region of the CMD must have accumulated in the surface regions an amount of carbon that corresponds to a specific range of C/O; in the 2.5 M⊙ case discussed here, this is 1.7 < C/O < 2.8. We see that this result cannot be fully generalised, as the exact C/O range for the 1.5 < J − K < 2.0 mag condition is sensitive to the mass and the metallicity of the star considered.
Turning to the 4 M⊙ model star, whose evolutionary track is reported in cyan in Fig. 3, the results reported in Fig. 2 suggest that massive AGBs evolve into the 1.5 < J − K < 2.0 mag region of the plane during the early phases following the ignition of HBB, when the depletion of the surface carbon and the synthesis of nitrogen begins. During this period the luminosity increases as a reaction to the start of HBB, the star expands and cools, while the rate of mass loss increases, so that the circumstellar envelope (for the reasons discussed earlier in this section) becomes an environment favourable for the formation of dust, which (in the present case) is mostly composed of silicates, with traces of alumina dust (Ferrarotti & Gail 2006; Dell’Agli et al. 2014b; Ventura et al. 2014). This behaviour can be considered as typical of massive AGBs belonging to the group III) introduced by Ventura et al. (2022), provided that the metallicity is solar or slightly sub-solar, which is the case for the intermediate-mass populations of the LMC and SMC.
The results shown in Fig. 2, when compared to those reported in Fig. 1, lead to two important conclusions. First, the time spent by massive AGBs in the 1.5 < J − K < 2.0 mag region of the CMD is significantly shorter than for carbon stars (in the specific cases considered here, this time is equivalent to ∼104 yr and ∼6 × 10⁴ yr for the 4 M⊙ and 2.5 M⊙ model stars, respectively). An additional important conclusion drawn from an inspection of Figs. 1 and 2 is that the J magnitudes of the stars belonging to groups II and III are significantly different when they enter the J region. The inclusion of massive AGBs in the J region of the CMD is sensitive to the choice made for the J extension of the selected box: for instance, it is clear from inspection of Fig. 3 that when the recommended choice proposed by Magnus et al. (2024) is adopted, the 4 M⊙ model star considered here would escape detection within the J region.
3.4. The AGB population in the J region of the CMD
The results shown in Fig. 3 indicate that the choice of the size of the box defining the J region proposed by Magnus et al. (2024) is tailored ad hoc to restrict the attention on carbon stars only; indeed, this choice rules out massive AGBs, which evolve to be brighter than the lower J magnitude considered by Magnus et al. (2024), as well as possible contaminations from low-mass, O-rich stars, which (if present) would evolve to lower J fluxes than the minimum indicated in the aforementioned study.
A deeper inspection of Fig. 3 suggests that the slope of the evolutionary tracks within the J region of the CMD changes with the progenitor’s mass: while the J flux of M ≥ 2 M⊙ stars keeps constant or even increases during the J phase, the lower mass counterparts are exposed to a more abrupt transition upon becoming carbon stars, which leads to a fast drop in the J flux, such that the evolutionary tracks (see the 1.1 M⊙, 1.25 M⊙ and 1.5 M⊙ cases in Fig. 3) cross the J region with a negative slope, pointing to the faint (right) side of the CMD.
These differences are related to the modality with which the transition from an M to a C star occurs in stars of different masses. First, M ≥ 2 M⊙ stars lose very little mass during the initial AGB phases when they evolve as O-rich objects because they are characterised by convective envelopes with masses above ∼1 M⊙. This guarantees a sufficiently high gravitational attraction in the surface regions, which prevents intensive mass loss. When reaching the C-star stage, their surface C/O slightly exceeds unity and then grows gradually, because the carbon dredged-up during the chain of TDU events is efficiently diluted with the massive envelope, which prevents dramatic changes in the surface C/O ratio. These objects are expected to populate the J region during different inter-pulse phases, and then to evolve off this zone of the CMD only after a further series of TDU episodes makes C/O to grow greater than ∼2.5 − 3. This is the situation that we encounter earlier in this section when discussing the 2.5 M⊙ model star, whose evolution was shown in Fig. 1. The slope of the evolutionary track within the J regions stems from the balance between the gradual increase in the luminosity, due to the growth of the core mass, and the rise in the surface C/O, which favours carbon dust production, triggering a more and more extended depression of the SED in the J spectral region. Because in these stars the increase in C/O proceeds gradually, the first effect prevails slightly, particularly during the phases immediately after the entrance into the J region; thus, the slope of the evolutionary tracks within the J region is positive (or at least flat).
The stars descending from progenitors of mass below 2 M⊙ evolve differently because the mass of the envelope is of a few tenths of solar masses when the transition to C star occurs. This is because when the AGB phase begins, their envelope is less massive than that of the higher mass counterparts and this leads to lower surface gravities, which enhances the mass loss rate experienced by the star during the O-rich phase. Under these conditions, the transition to the C-star phase is generally followed by a significant increase in the surface carbon content, because dilution with the gas stored in the external envelope is much less efficient than in the higher mass carbon stars. In these low-mass stars the production of carbon dust takes place very efficiently since they become carbon stars: this results in a significant depression of the J flux. This is the reason behind the negative slope of the evolutionary tracks in the CMD, as made clear in Fig. 3.
From these results, we understand that the modality with which the stars enter and evolve into the J region changes notably with the progenitor’s mass. The objects of higher mass, in the 2 − 3 M⊙ range, spend a significant fraction of the time in the J region, evolving as carbon stars. Eventually they end up evolving off that region only after repeated TDU events lift the surface carbon to quantities that favour efficient dust formation and large-scale IR emission. Conversely, the evolution of the low-mass counterparts within the J region appears more likely to be a real transition phase, as the effects of each TDU event on the surface C/O (and, hence, on the DPR) are more dramatic. Thus, they easily evolve off the region of the CMD considered.
These arguments regarding the transit of the stars within the J region of the CMD are confirmed by the results shown in Fig. 4, where the duration (τJ) of the stay in the J region of the stars of different metallicity is shown as a function of the initial mass and the age (left and right panels, respectively). In cases of stars with metallicities Z = 8 × 10⁻³, whose evolutionary tracks are shown in Fig. 3, we see from the left panel of Fig. 4 that τJ is positively correlated with the mass of the star and changes from ∼5 × 10³ yr for M = 1.1 M⊙ and to ∼6 × 10⁵ yr for M = 2.5 M⊙. The positive trend of τJ versus mass shows a turning point for the 3 M⊙ model star because the timescale of the AGB evolution of the latter is shorter than that of the lower mass counterparts. The range of masses considered for the Z = 8 × 10⁻³ case is limited to the 1.1 − 3 M⊙ range: this is because the stars that are characterised by M < 1.1 M⊙ at the TRGB never enter the J region; whereas M > 3 M⊙ stars evolve to the red side of the plane, but they are too bright with respect to the vertical size of the J box. This limitation indicates that only stars formed between ∼300 Myr and ∼4 Gyr ago populate the J region of the CMD, as shown in the right panel of Fig. 4.
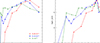 |
Fig. 4. Duration of the evolutionary phase spent by model stars of different metallicity in the box delimiting the J region of the (J − K, J) plane, according to the definition by Magnus et al. (2024), as a function of the stellar mass (left panel) and age (right). The masses of M < 1.5 M⊙ stars reported in the abscissa of the left panel refer to the values at the start of the core helium-burning phase. |
The τJ versus mass trends for the Z = 10−3 and Z = 4 × 10⁻³ cases shown in Fig. 4 are generally flatter than Z = 8 × 10⁻³. This is because the C-star condition is reached more easily, owing to the lower content of oxygen, so that the lower mass threshold required for the stars to populate the J region is lower. We see in Fig. 4 that the minimum mass evolving into the J region is 0.8 M⊙ and M = 0.9 M⊙, for Z = 10−3 and Z = 4 × 10⁻³, respectively.
The variation of τJ with the stellar age, shown in the right panel of Fig. 4, exhibits a behaviour similar to the trend τJ versus mass, given the tight relationship between stellar mass and age. It is clear the importance of the stellar formation that occurred around one Gyr ago for the numerical consistency of the population of the J region of the plane.
4. The J region stellar population of the LMC
We used the methodology described in Section 2 to build synthetic distributions of LMC stars on the different observational planes, based on the SFH given in Mazzi et al. (2021) and the AMR by Carrera et al. (2008). The results of this population synthesis analysis in the (J − K, K) CMD is shown in Fig. 6. In the distribution of the stars, we recognise the typical features outlined, for instance, by Marigo et al. (2003). In particular, we find: (a) the drop in the K-band luminosity function at K ∼ 11.9 mag, where the TRGB is located; (b) the cut-off of the oxygen-rich AGB luminosity function at K ∼ 10.7 mag; and (c) the colour gap between the O and C-rich AGB populations, in the 1.5 < (J − K)< 2.0 mag region. Most of the carbon stars are found in the (J − K)> 1.2 mag region, although a few C-rich objects are also expected to populate the AGB branch above the TRGB; they are the progeny of 2 − 3 M⊙ stars, which have evolved into the blue region of the CMD during the phases immediately following the start of the C-star phase (an exhaustive discussion on this argument is given in Gavetti et al., in prep.).
Specifically, with respect to the J region, it is clear from the arguments presented in the previous section that the numerical consistency and the distribution of the stars within this region of the CMD depends on the number of stars descending from ∼1 − 3 M⊙ progenitors currently evolving through the AGB phase. Therefore, the SFH of the galaxy in the epochs between 300 Myr and 4 Gyr ago is the key factor to be considered, along with the AMR, particularly the metallicity of the interstellar medium in those times. These restrictions are partly sensitive to the criterion adopted to select the J region and strictly hold for that proposed by Magnus et al. (2024). If the J region considered was extended to brighter J fluxes than the limits proposed by Magnus et al. (2024), stars more massive than 3 M⊙ would need to be considered; thus, even the recent star formation, occurring ∼100 − 200 Myr ago, should be examined. No significant changes would be expected if the chosen box for the J region were to be extended to fainter magnitudes, since the present choice is such that, as shown in Fig. 3, even the evolutionary tracks of the lowest luminosity carbon stars, namely those descending from old, low-mass progenitors cross the J region of the (J − K, J) plane. We note that the only exception would be found in the galaxies characterised by the presence of an old, metal-rich stellar population. This is due to the fact that under those conditions low-mass, oxygen-rich stars during the final AGB phases produce amounts of silicate that are sufficiently large to deviate the evolutionary tracks towards the faint side of the 1.5 < J − K < 2.0 mag strip of the CMD. However, this is not the case for the LMC, nor for the SMC, as discussed in the next section.
The J luminosity function (JLF) obtained for the LMC by means of the population synthesis method is shown as a black line in the left panel of Fig. 5, while the distribution of the (initial) masses of the stars populating the J region is shown in the right panel of the figure.
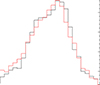 |
Fig. 5. Left: The J luminosity function of the LMC AGB stars populating the J region of the (J − K, J) plane, obtained by means of population synthesis, is shown in black, and compared with the JLF by Magnus et al. (2024) (red line). Right: The distribution of the masses of the stars in the J region of the (J − K, J) plane, which correspond to the JLF shown in the left panel. The masses of M < 1.5 M⊙ stars refer to the values at the start of the core helium-burning phase. |
An inspection of Fig. 5 shows a satisfactory agreement between the present findings and the results shown in the Fig. F.3 in Magnus et al. (2024), particularly with respect to the peak of the distribution at MJ = −6.35 mag and the general shape of the JLF, which drops to half the peak value at MJ = −6.55 mag and MJ = −6 mag on the bright and faint sides of the distribution, respectively. Full consistency is also found for the average J magnitude, which is around MJ = −6.25 mag in both cases.
The mass distribution shown in the right panel of Fig. 5 shows up two peaks, centered at 1.7 M⊙ and 2.5 M⊙, related to stars formed during the peaks in the SFH of the LMC occurred 1.5 Gyr and 800 Myr ago (Mazzi et al. 2021), respectively. The older peak in the SFH is higher than the younger one, so that 1.5 ≤ M < 1.8 M⊙ stars currently evolving along the AGB outnumber by almost a factor two the 2.2 − 2.7 M⊙ counterparts. However, this is not the case for the J region since, as shown in Fig. 4, the latter stars spend a significant fraction of the AGB lifetime within that area of the CMD; thus, they provide the dominant contribution to the overall population of the J region: the peak in the JLF at MJ = −6.35 mag (as well as the two nearest bins in the distribution) are almost entirely due to the presence of ∼2.5 M⊙ stars. The asymmetry of the JLF around the peak value is due to the excess of 1.5 − 2 M⊙ stars, which provide the dominant contribution to the faint side of the distribution, with respect to M > 2.5 M⊙ stars, which contribute to the bright side of the JLF.
The present analysis indicates that about two-thirds of the stars in the J region of the LMC descend from ∼2.5 M⊙ progenitors, formed between 700 Myr and 1 Gyr ago. These stars are characterised by surface C/O ratios in the 1.5 − 3 range and are producing carbon dust at rates ∼2 − 3 × 10⁻⁹ M⊙/yr, distributed between solid carbon dust (which accounts for a fraction of the total dust formed between 50% and 75%), and silicon carbide (SiC) (whose contribution is between 25% and 50%). Solid iron and other dust species are formed in minor quantities and do not affect the shape of the SED. The luminosities of these objects are in the 7000 − 9000 L⊙ range, which correspond to J magnitudes −6.6 < MJ < −6.2: as shown in Fig. 3, they populate the upper part of the J region.
Dell’Agli et al. (2014a, 2015a) suggested that the sources of the LMC with the largest IR emission, which populate the reddest regions of the observational planes built with the IRAC Spitzer filters, are the progeny of 2.5 − 3 M⊙ stars, and are currently providing the dominant contribution to the overall DPR from the entire galaxy. From the present investigation we deduce that the stars that provide the most relevant contribution to the population of the J region of the LMC are the immediate progenitors of the reddest objects investigated by Dell’Agli et al. (2014a, 2015a).
A significant fraction of the stars in the J region (around 30%) are the progeny of 1.5 − 1.8 M⊙ stars formed during the epochs from 1.5 to 2.5 Gyr ago. The surface C/O of these objects is between 1.5 and 2, while the DPRs are in the 2−3 × 10⁻⁹ M⊙/yr range, with the relative contributions from solid carbon and SiC not deviating significantly from those given above for the higher mass stars. These stars, with luminosities between 5 × 10³ L⊙ and 7 × 10³ L⊙, provide the most relevant contribution to the JLF at −6.3 < MJ < −6 and are mostly located in the fainter side of the J box.
The AGB population of the LMC within the J region also encompasses ∼10% of stars formed around 300 Myr ago from ∼3 M⊙ progenitors, located in the bright side of the J region (see Fig. 3), where they evolve at luminosities slightly above 104 L⊙. Among the sources in the J region these bright stars are those producing dust at the largest rates of ∼5 × 10⁻⁹ M⊙/yr.
Towards the low-luminosity tail of the JLF shown in the left panel of Fig. 5, particularly in the MJ > −6 mag region, we find a group of stars descending from progenitors of mass slightly super-solar, which account for ∼2% of the whole population in the J region of the plane. The reason why only a few of these objects are currently found in the J region is related to the rapidity with which the evolutionary tracks cross this part of the plane, for the arguments discussed in Section 3.4. These are the oldest among the LMC stars considered here, and formed 3−4 Gyr ago.
4.1. The role of the RGB mass loss
According to Mazzi et al. (2021), some episodes of star formation took place in the LMC in epochs older than 4 Gyr, when stars of masses below ∼1.2 M⊙ formed and are now evolving through the AGB. In contrast to their younger and more massive counterparts, the AGB evolution of these stars – specifically, their dust-production efficiency and the resulting displacement of their evolutionary tracks across the observational planes considered – is strongly influenced by δMRGB (i.e. the mass lost during the RGB phase prior to helium-flash ignition). In a recent work on the evolved stellar population of M31, Gavetti et al. (2025) outlined the relevant role of δMRGB in shaping the luminosity function of the stars of the galaxy populating the blue side of the CMDs obtained with some HST filters, accounting for ∼90% of the entire sample. One of the conclusions drawn by Gavetti et al. (2025) is that for stars of solar or sub-solar mass, RGB mass losses of δMRGB ∼ 0.2 − 0.3 M⊙ are required to reproduce the observed luminosity function, with the detailed value of δMRGB increasing with metallicity.
As regards the analysis in the present investigation, the choice of δMRGB is potentially affecting the statistics of the AGB population within the J region (and, particularly, the last point discussed in the previous sub-section) that the oldest stars now sampled in the J region of the LMC were formed ∼4 Gyr ago. This is because the path towards the formation of carbon stars of low-mass objects depends on the mass of the envelope when the AGB phase begins: in the metal-poor domain, which must be considered if the oldest epochs are taken into account, all the stars that reach the AGB with mass M ≥ 0.8 M⊙ become C-stars (Kamath et al. 2023); thus, their evolutionary tracks evolve to the red, and thereby enter the J region of the CMD. When mass loss during the RGB is considered, the threshold initial mass of the star required to become carbon star is higher than the value given above, which restricts the mass range of the stars potentially able to evolve within the J region.
As stated in Section 2, in the analysis developed here, we consider the results by Gavetti et al. (2025), assuming δMRGB = 0.2 M⊙ for all the stars of initial mass M < 1.5 M⊙. This choice rules out the possibility that these objects – which, on the basis of the SFH adopted here, we estimate to account for ∼30% of the AGB population of the LMC – would form carbon dust and evolve to the red side of the CMD. This leads to the conclusion that only stars younger than 4 Gyr would have to be considered for the statistical analysis of the J region.
To understand the potential impact of δMRGB on the synthetic JLF of the LMC, we ran numerical simulations based on the assumption that no mass loss occurred during the RGB evolution. The results, shown in Fig. 7, indicate that in this case the JLF would exhibit a low-luminosity peak, whose height is comparable to (albeit lower than) the main peak discussed above. While the δMRGB = 0 assumption is not realistic, we deduce that a minimum RGB mass loss is required to reproduce the results by Magnus et al. (2024), and that these findings are consistent with those reported in Gavetti et al. (2025).
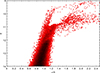 |
Fig. 6. Synthetic distribution of LMC stars evolving through the AGB phase in the colour-magnitude (J − K, K) plane. |
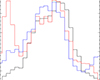 |
Fig. 7. The J luminosity function of the stars in the J region of the LMC, derived on the bases of the assumptions discussed in Section 2 (black line), is compared with the results obtained when the metallicity of the stars is artificially kept to Z = 10−3 until presently (blue line) and when RGB mass loss is neglected (red). |
4.2. The role of the metallicity enrichment
The study by Carrera et al. (2008) showed that LMC stars have a mean metallicity of [Fe/H] = −0.5 and that stars younger than 3 Gyr formed with [Fe/H] > −0.5. Based on the discussion presented earlier in this section, we know that these slightly sub-solar chemistries characterise the stars within the J region of the CMD, of interest here.
We checked the role played by the chosen AMR by repeating the population synthesis simulation, assuming that the metallicity of the stars would be left unchanged over time and kept at Z = 10−3 until the present epoch. This experiment was not only intended to test the uncertainties related to the assumed AMR, but also (in a future-forward perspective) to understand which type of situation would have to be expected when metal-poor galaxies are considered.
The results we obtained are shown in Fig. 7, where the derived JLF (blue line) is compared with the JLF discussed in the first part of this section (reported in black), which reproduces the results by Magnus et al. (2024). While we note some similarities, particularly in the location of the peak at MJ ∼ −6.3 mag and in the morphology of the distribution on the bright side, we also detected some differences that concern the faint side. Here, the ‘metal-poor’ JLF is significantly flatter than that based on the AMR by Carrera et al. (2008). This result, which is apparently in contrast to the general idea that metal-poor stars evolve at higher luminosities than the lower metallicity counterparts of the same mass, is explained by the fact that metal-poor stars become carbon stars more easily (Kamath et al. 2023), owing to the lower initial oxygen content. As regards the case discussed here, we find that when the low metallicities are adopted, the stars with a mass of ∼1.5 M⊙ reach the C-star stage in a less advanced AGB phase than their higher metallicity counterparts of the same mass; thus, they spend a longer time within the J box, so their behaviour is more similar to that of the higher mass counterparts discussed in Section 3.4. These stars are responsible for the bump in the JLF in the −6.2 < MJ < −6.1 range, as seen in Fig. 7. A further difference introduced by the assumption that the stellar population of the LMC is metal-poor is found in the low-luminosity tail of the JLF, at MJ ∼ −5.8 mag. This is due to the presence of low-mass (1 − 1.3 M⊙) stars. While in the previous simulation, these stars barely entered the J box, while in the present case (due to the easier way in which they become C stars) they provide a significant contribution to the population on the faint side of the box identifying the J region of the CMD.
5. A comparative analysis of the SMC versus the LMC
The same approach based on population synthesis used for the study of the LMC was applied to investigate the J population of the SMC and compare the synthetic JLF with that given in Magnus et al. (2024). As discussed in Section 2, in this case we adopted the SFH and the AMR given in Rubele et al. (2018).
The star formation process in the two galaxies proceeded with different modalities. First, the metal enrichment in the LMC was more efficient than in the SMC, which reflects in a lower average [Fe/H] for the latter galaxy, which affects, in particular, the stellar population formed over the last 2 Gyr. Furthermore, while the SFH of the LMC is characterised by the two peaks mentioned earlier in this section, which occurred 800 Myr and 1.5 Gyr ago, in the SMC there was a single period of intense activity between 4 Gyr and 6 Gyr ago, when the rate of star formation was about a factor of 2 higher than that experienced between 300 Myr and 2 Gyr ago (Rubele et al. 2018). Because of these dissimilarities between the histories of the two galaxies, the stellar populations currently evolving along the AGB are significantly different: the AGB population of the SMC is dominated by stars descending from 1 − 1.5 M⊙ progenitors, formed during the times running from 6 Gyr ago to 2 Gyr ago; whereas for the LMC, we highlight the fact that the majority of the AGB stars descend from 1.5 − 1.8 M⊙ stars formed 1−2 Gyr ago. It is important to understand if (and how) these differences affect the stellar population of the two galaxies in the J region of the CMD.
Fig. 8 shows the comparison between the JLF obtained for the SMC (indicated with the solid black line) and the corresponding distribution obtained for the LMC discussed earlier in this section (reported in grey). The JLF of the SMC was artificially scaled to ease the comparison between the two distributions. The first clear difference between the JLF of the two galaxies is the location of the peak, which is almost 0.2 mag fainter in the SMC than in the LMC. This is not surprising, considering that the peak of the JLF at MJ = −6.35 mag of the LMC was determined by the presence of a large number of stars descending from ∼2.5 M⊙ progenitors; conversely, the peak in the JLF of the SMC, located at MJ = −6.15 mag, is due to the progeny of 1.2 − 1.8 M⊙ stars, which are generally fainter than the 2.5 M⊙ stars populating the J region of the LMC (see Fig. 3).
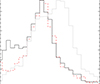 |
Fig. 8. The comparison between the J luminosity functions obtained for the LMC (grey line) and the SMC (black). The red, dashed line indicates the results obtained for the SMC on the basis of the assumption that 1 − 1.3 M⊙ metal-poor stars experience a 0.3 M⊙ mass loss during the RGB evolution. |
It is not only the peak, but the whole JLF of the SMC that gets shifted towards smaller J fluxes in comparison to the LMC. This is due to the smaller mass of the progenitors populating the AGB of the SMC stars with respect to the LMC, as well as more specifically, the J region of the CMD. In the LMC, as shown in the right panel of Fig. 5, we find that the sources populating the J region are mainly 2 M⊙ < M < 3 M⊙ stars; however, the mass distribution of the SMC is more homogeneous, with the majority made up of 1 M⊙ < M < 1.5 M⊙ objects. The presence of such a significant fraction of low-mass stars is also the reason for the presence of the low-luminosity tail in the −5.9 < MJ < −5.7 mag range of the JLF, which can be seen in Fig. 8.
The comparison between the JLF obtained by means of population synthesis and the results from Magnus et al. (2024) are less straightforward and indicative than for the LMC, given the low number of sources on which the statistical analysis by Magnus et al. (2024) is based. The JLF reported in Fig. 8 is similar to the one shown in Fig. F.3 by Magnus et al. (2024) with respect to the location of the peak and the general shape of the JLF on the bright side of the distribution. Differences were found on the faint side of the JLF, mainly because of the aforementioned low-luminosity tail, which was not especially evident in the results reported by Magnus et al. (2024). This tail is also the reason for the difference in the average J magnitude, which is found to be MJ = −6.1 mag in the present analysis, whereas Magnus et al. (2024) find MJ = −6.18 mag.
The tail on the faint side of the synthetic distribution is due to the presence of a population of old, metal-poor stars in the J region of the SMC, which descend from progenitors of a mass that is slightly above solar. The possibility that these stars enter the J region is tightly linked to the mass lost during the RGB, δMRGB: significant RGB mass loss reduces the mass with which the stars start the AGB, so that they undergo an evolutionary path similar to that of the stars belonging to the group I discussed in Section 3.3, with no chance of populating the J region of the plane. The results discussed above, reported with the black, solid line in Fig. 8, were obtained with a mass loss δMRGB = 0.2 M⊙ for stars of mass below M = 1.5 M⊙. If we assume δMRGB = 0.3 M⊙ for all M < 1.5 M⊙ stars, we obtain the JLF indicated with the red, dashed line in Fig. 8. This is in much better agreement with the results by Magnus et al. (2024), as also confirmed by the derived average J flux, which is MJ = −6.16 mag. The choice of δMRGB does not significantly affect the location of the peak of the JLF, because the bulk of the population of the J region of the SMC is made up of the progeny of 1.2 − 1.8 M⊙ stars, which are touched only marginally by the assumption of δMRGB, except for the smaller masses in the mass interval. In a more general context, the results published by Freedman & Madore (2020) and Lee et al. (2024a, 2024b) seem to rule out the presence of low-luminosity tails in the JLF of all the galaxies investigated: this suggests that significant mass loss occurred during the RGB phase of low mass stars, in agreement with the conclusions given above.
The issue of the mass loss experienced by the stars during the RGB phase is much more relevant for the SMC than for the LMC. This is because the SMC hosts a much higher fraction of low-mass stars, whose AGB evolution is extremely sensitive to the assumed δMRGB, which inevitably reflects on the statistics of the masses and luminosities of the population of the J region. The lower metallicity of SMC stars is a further motivation to take particular care of the mass-loss process during the RGB, as metal-poor stars reach the C-star stage more easily; thus, it is more likely that they eventually enter the J region.
The present analysis of the properties of the JLF, while limited to only two galaxies, is quite exhaustive, as the LMC and the SMC are likely to represent the two extreme cases that can occur, at least as far as the peaks of the distribution are concerned. It is hard to think that there could be galaxies whose JLF peaks brighter than the LMC, i.e. −6.35 mag, which we have seen to correspond to the average J magnitude of ∼2.5 M⊙ stars, when they evolve within the J region. A brighter peak would demand a dominant population of stars of 3 M⊙ or more, which is hard to believe, even if intense star formation occurred during the epochs younger than 300 Myr; indeed, the AGB evolutionary time scales drop significantly in the M > 2.5 M⊙ mass domain, while the MJ versus mass relationship becomes steeper and steeper in that mass range. This conclusion holds even more if the choice recommended by Magnus et al. (2024) to identify the J region is adopted, since M > 3 M⊙ stars are not expected to populate the J region, as shown in Fig. 3.
The SMC represents the opposite extreme case, in that we consider rather unlikely the presence of galaxies whose peak of the JLF is fainter than that of the SMC (i.e. −6.15 mag). Earlier in this section, we discuss that the reason for this rather faint peak (at least when compared to the LMC) comes from the fact that the older and lower mass population of the SMC (compared to the LMC) mostly formed around 5 Gyr ago. Even an older burst in the star formation activity would barely change the location of the peak of the JLF, because that would favour the formation of low-mass stars that hardly enter the J region, as they mostly evolve as the stars belonging to the group I discussed in Section 3.3.
Assessing whether the peak J (MJpeak) or, rather, the average J magnitude (MJav) of the stars located in the J region of the plane should be used as distance indicator is not an easy task, at least on the basis of the present results, which are restricted to two galaxies only. Use of the MJpeak has the advantage that the attention can be focused on a narrow range of masses (and, hence, formation epochs), with a strong bias towards the stars formed around 1 Gyr ago. With the exception of those cases where a burst of star formation occurred 4 Gyr ago (which is the case for the SMC), we expect to find MJpeak ∼ −6.3 mag. On the other hand, the average J magnitude is less sensitive to the details of the SFH between 800 Myr and 4 Gyr ago, as it is affected by the J fluxes of a wider range of stellar masses, whose evolutionary tracks enter the J region. The differences arising from variation in the SFH are softened in this case, as confirmed by the similarity between the values found for the LMC and SMC, which are much closer (δMJav ∼ 0.07 mag) than the corresponding peak magnitudes (δMJpeak ∼ 0.2 mag). The shortcoming of the use of MJav is that the results are affected by the uncertainties connected to the modelling of the low mass stars, whose presence has practically no influence on the determination of the peak value. Adopting the average J magnitude pushes the investigation to confront issues related to the treatment of mass loss along the RGB, a physical mechanism highly uncertain, but with a generally strong impact on the statistics for the AGB population of galaxies (Gavetti et al. 2025).
6. Conclusions
We used a population synthesis approach to investigate the distribution of MCs AGB stars that occupy the so-called J region of the (J − K, J) CMD. This analysis was stimulated by recent studies suggesting that the J-band luminosity function of stars in that region of the plane could serve as distance indicators of galaxies.
Based on the morphology of the evolutionary tracks of stars of various mass and chemical composition on the (J − K, J) plane, we find that the J population of the galaxies descend from 1 − 3 M⊙ stars, between 300 Myr and 5 Gyr old, caught in the evolutionary phases between the stage when they become carbon stars and the phase when the surface C/O ∼ 3. We note that the latter condition favours a significant shift of the SED to the IR spectral region, so that the stars end up evolving off the J region.
The timing of the transit of stars through the J region is extremely sensitive to the mass of the star: while M > 2 M⊙ stars remain in that zone of the plane for a series of five to six inter-pulse phases, for a total duration slightly shorter than 1 Myr, the lower-mass counterparts evolve faster, and rapidly evolve to the red side of the plane. In light of this, we expect that in several galaxies the J luminosity function of the stars populating the J region peaks at MJ ∼ −6.3 mag, which is the J magnitude of 2.5 M⊙ stars during the evolution in that part of the CMD.
The results concerning the LMC are satisfactory and confirm the conclusion given above. The simulation obtained by applying the population synthesis method is fully consistent with the observational scenario, as both the peak of the distribution, found at MJ ∼ −6.35 mag, and the width of the J luminosity function on both sides of the peak, are nicely reproduced. Mass loss during the RGB evolution of the order of 0.2 M⊙, in full agreement with previous investigations, must be invoked to prevent the appearance of an unobserved extended tail on the faint side of the J luminosity function.
The J luminosity function of the SMC is shifted towards higher MJ values than the LMC, the main peak being located at MJ ∼ −6.15 mag. We interpret this difference as due to the intense star formation that occurred in the SMC around 5 Gyr ago, when stars of mass slightly above solar formed and are now evolving along the AGB. Under these specific conditions these stars outnumber the 2 − 3 M⊙ counterparts, so the peak of the distribution of the J magnitudes occurs at fainter J fluxes than in the LMC. Given the dominant contribution from low-mass stars, in this case, the treatment of the RGB mass loss is more relevant than in the case of the LMC. While the expected location of the peak is essentially independent of the amount of mass lost by the stars as they continue climbing along the RGB, reproducing the faint side of the luminosity function and deriving an average J magnitude MJ ∼ −6.18 mag (in agreement with the observations) requires assuming that stars with masses in the 1 − 1.3 M⊙ range lose 0.3 M⊙ before reaching the TRGB.
Data availability
The evolutionary sequences of the stars of different initial mass and metallicity are available at the CDS via https://cdsarc.cds.unistra.fr/viz-bin/cat/J/A+A/707/A384
Acknowledgments
CV and PV acknowledge support by the INAF-Theory-GRANT 2022 “Understanding mass loss and dust production from evolved stars”.
References
- Bortolini, G., Östlin, G., Habel, N., et al. 2024, A&A, 689, A146 [NASA ADS] [CrossRef] [EDP Sciences] [Google Scholar]
- Bortolini, G., Correnti, M., Adamo, A., et al. 2025, ApJ, 991, 212 [Google Scholar]
- Carrera, R., Gallart, C., Hardy, E., et al. 2008, AJ, 135, 836 [NASA ADS] [CrossRef] [Google Scholar]
- Correnti, M., Bortolini, G., Dell’Agli, F., et al. 2025, ApJ, 990, 72 [Google Scholar]
- Dell’Agli, F., Ventura, P., Garcia Hernandez, D. A., et al. 2014a, MNRAS, 442, L38 [Google Scholar]
- Dell’Agli, F., García-Hernández, D. A., Rossi, C., et al. 2014b, MNRAS, 441, 1115 [Google Scholar]
- Dell’Agli, F., Ventura, P., Schneider, R., et al. 2015a, MNRAS, 447, 2992 [Google Scholar]
- Dell’Agli, F., García-Hernández, D. A., Ventura, P., et al. 2015b, MNRAS, 454, 4235 [Google Scholar]
- Dell’Agli, F., Di Criscienzo, M., Boyer, M. L., et al. 2016, MNRAS, 460, 4230 [Google Scholar]
- Dell’Agli, F., Di Criscienzo, M., Ventura, P., et al. 2018, MNRAS, 479, 5035 [Google Scholar]
- Dell’Agli, F., Di Criscienzo, M., García-Hernández, D. A., et al. 2019, MNRAS, 482, 4733 [Google Scholar]
- Ferrarotti, A. S., & Gail, H.-P. 2001, A&A, 371, 133 [NASA ADS] [CrossRef] [EDP Sciences] [Google Scholar]
- Ferrarotti, A. S., & Gail, H.-P. 2002, A&A, 382, 256 [NASA ADS] [CrossRef] [EDP Sciences] [Google Scholar]
- Ferrarotti, A. S., & Gail, H.-P. 2006, A&A, 447, 553 [CrossRef] [EDP Sciences] [Google Scholar]
- Freedman, W. L., & Madore, B. F. 2020, ApJ, 899, 67 [NASA ADS] [CrossRef] [Google Scholar]
- Freedman, W. L., Madore, B. F., Hoyt, T. J., et al. 2025, ApJ, 985, 203 [Google Scholar]
- Gail, H.-P., & Sedlmayr, E. 1985, A&A, 148, 183 [Google Scholar]
- Gavetti, C., Ventura, P., Dell’Agli, F., et al. 2025, A&A, 699, A23 [NASA ADS] [CrossRef] [EDP Sciences] [Google Scholar]
- Iben, I. 1974, ARA&A, 12, 215 [NASA ADS] [CrossRef] [Google Scholar]
- Kamath, D., Dell’Agli, F., Ventura, P., et al. 2023, MNRAS, 519, 2169 [Google Scholar]
- Karakas, A. I., & Lattanzio, J. C. 2014, PASA, 31, e030 [NASA ADS] [CrossRef] [Google Scholar]
- Kobayashi, C., Karakas, A. I., & Lugaro, M. 2020, ApJ, 900, 179 [Google Scholar]
- Lee, A. J., Freedman, W. L., Jang, I. S., Madore, B. F., & Owens, K. A. 2024a, ApJ, 961, 132 [Google Scholar]
- Lee, A. J., Weisz, D. R., Ren, Y., et al. 2024b, ArXiv e-prints [arXiv:2410.09256] [Google Scholar]
- Li, S., Riess, A. G., Scolnic, D., Casertano, S., & Anand, G. S. 2025, ApJ, 988, 97 [Google Scholar]
- Madore, B. F., & Freedman, W. L. 2020, ApJ, 899, 66 [NASA ADS] [CrossRef] [Google Scholar]
- Magnus, E., Groenewegen, M. A. T., Girardi, L., et al. 2024, A&A, 691, A350 [NASA ADS] [CrossRef] [EDP Sciences] [Google Scholar]
- Marigo, P. 2002, A&A, 387, 507 [NASA ADS] [CrossRef] [EDP Sciences] [Google Scholar]
- Marigo, P., Girardi, L., & Chiosi, C. 2003, A&A, 403, 225 [NASA ADS] [CrossRef] [EDP Sciences] [Google Scholar]
- Marini, E., Dell’Agli, F., Groenewegen, M. A. T., et al. 2021, A&A, 647, A69 [NASA ADS] [CrossRef] [EDP Sciences] [Google Scholar]
- Mazzi, A., Girardi, L., Zaggia, S., et al. 2021, MNRAS, 508, 245 [NASA ADS] [CrossRef] [Google Scholar]
- Nanni, A., Bressan, A., Marigo, P., et al. 2013, MNRAS, 434, 2390 [NASA ADS] [CrossRef] [Google Scholar]
- Nanni, A., Bressan, A., Marigo, P., et al. 2014, MNRAS, 438, 2328 [NASA ADS] [CrossRef] [Google Scholar]
- Nanni, A., Marigo, P., Groenewegen, M. A. T., et al. 2016, MNRAS, 462, 1215 [NASA ADS] [CrossRef] [Google Scholar]
- Nanni, A., Groenewegen, M. A. T., Aringer, B., et al. 2019, MNRAS, 487, 502 [NASA ADS] [CrossRef] [Google Scholar]
- Nenkova, M., Ivezic, Z., & Elitzur, M. 1999, Thermal Emission Spectroscopy and Analysis of Dust, Disks, and Regoliths, 20 [Google Scholar]
- Nikolaev, S., & Weinberg, M. D. 2000, ApJ, 542, 804 [NASA ADS] [CrossRef] [Google Scholar]
- Paczyński, B. 1970, Acta Astron., 20, 47 [NASA ADS] [Google Scholar]
- Ripoche, P., Heyl, J., Parada, J., et al. 2020, MNRAS, 495, 2858 [NASA ADS] [CrossRef] [Google Scholar]
- Romano, D. 2022, A&ARv, 30, 7 [NASA ADS] [CrossRef] [Google Scholar]
- Rubele, S., Pastorelli, G., Girardi, L., et al. 2018, MNRAS, 478, 5017 [NASA ADS] [CrossRef] [Google Scholar]
- Sackmann, I.-J., & Boothroyd, A. I. 1992, ApJ, 392, L71 [NASA ADS] [CrossRef] [Google Scholar]
- Schneider, R., & Maiolino, R. 2023, ArXiv e-prints [arXiv:2310.00053] [Google Scholar]
- Schneider, R., Valiante, R., Ventura, P., et al. 2014, MNRAS, 442, 1440 [NASA ADS] [CrossRef] [Google Scholar]
- Schwarzschild, M., & Härm, R. 1965, ApJ, 142, 855 [NASA ADS] [CrossRef] [Google Scholar]
- Ventura, P., & D’Antona, F. 2005, A&A, 431, 279 [NASA ADS] [CrossRef] [EDP Sciences] [Google Scholar]
- Ventura, P., & Marigo, P. 2009, MNRAS, 399, L54 [Google Scholar]
- Ventura, P., & Marigo, P. 2010, MNRAS, 408, 2476 [Google Scholar]
- Ventura, P., D’Antona, F., Mazzitelli, I., et al. 2001, ApJ, 550, L65 [Google Scholar]
- Ventura, P., Di Criscienzo, M., Schneider, R., et al. 2012, MNRAS, 420, 1442 [Google Scholar]
- Ventura, P., Di Criscienzo, M., Carini, R., et al. 2013, MNRAS, 431, 3642 [NASA ADS] [CrossRef] [Google Scholar]
- Ventura, P., Dell’Agli, F., Schneider, R., et al. 2014, MNRAS, 439, 977 [NASA ADS] [CrossRef] [Google Scholar]
- Ventura, P., Dell’Agli, F., Tailo, M., et al. 2022, Universe, 8, 45 [NASA ADS] [CrossRef] [Google Scholar]
- Vincenzo, F., Belfiore, F., Maiolino, R., et al. 2016, MNRAS, 458, 3466 [NASA ADS] [CrossRef] [Google Scholar]
- Weinberg, M. D., & Nikolaev, S. 2001, ApJ, 548, 712 [Google Scholar]
The mass limits are slightly dependent on the metallicity. As discussed in Kamath et al. (2023), the lower threshold mass required to reach the C-star stage decreases for lower Z values, because the lower oxygen content eases the formation of carbon stars in metal-poor environments. The lower limit in mass for the ignition of HBB is lower the lower Z, given the hotter temperatures at the base of the envelope of metal-poor, massive AGBs (Dell’Agli et al. 2018).
All Figures
|
Fig. 1. Left: Time variation of the luminosity (black line, scale on the left) and the J magnitude (green, scale on the right) of a model star of initial mass 2.5 M⊙ and metallicity Z = 0.008. The black arrow indicates the start of the C-star phase. Right: Time evolution of the surface C/O and the DPR of the same model star shown in the left panel. Times are counted since the beginning of the TP-AGB phase. Grey-shaded regions indicate the phase during which 1.5 < J − K < 2 mag. |
| In the text | |
|
Fig. 2. Left: Time variation of the luminosity (black line, scale on the left) and the J magnitude (magenta, scale on the right) of a model star of initial mass 4 M⊙ and metallicity Z = 0.008. Right: Time evolution of the surface carbon (black line), nitrogen (blue), oxygen (red) (black scale on the right) and the DPR (green scale on the right) of the same model star shown in the left panel. Times are counted since the beginning of the TP-AGB phase. Grey-shaded regions indicate the phase during which 1.5 < J − K < 2 mag. |
| In the text | |
|
Fig. 3. Evolutionary tracks of model stars of metallicity Z = 8 × 10⁻³ on the (J − K, J) colour-magnitude diagram. The different points along the tracks refer to some selected evolutionary stages taken during the AGB phase, chosen in order to well represent the excursion of the tracks on the observational plane. The grey shaded region indicate the box chosen by Magnus et al. (2024) for the J region. The masses given for M < 1.5 M⊙ refer to the values attained at the TRGB. |
| In the text | |
|
Fig. 4. Duration of the evolutionary phase spent by model stars of different metallicity in the box delimiting the J region of the (J − K, J) plane, according to the definition by Magnus et al. (2024), as a function of the stellar mass (left panel) and age (right). The masses of M < 1.5 M⊙ stars reported in the abscissa of the left panel refer to the values at the start of the core helium-burning phase. |
| In the text | |
|
Fig. 5. Left: The J luminosity function of the LMC AGB stars populating the J region of the (J − K, J) plane, obtained by means of population synthesis, is shown in black, and compared with the JLF by Magnus et al. (2024) (red line). Right: The distribution of the masses of the stars in the J region of the (J − K, J) plane, which correspond to the JLF shown in the left panel. The masses of M < 1.5 M⊙ stars refer to the values at the start of the core helium-burning phase. |
| In the text | |
|
Fig. 6. Synthetic distribution of LMC stars evolving through the AGB phase in the colour-magnitude (J − K, K) plane. |
| In the text | |
|
Fig. 7. The J luminosity function of the stars in the J region of the LMC, derived on the bases of the assumptions discussed in Section 2 (black line), is compared with the results obtained when the metallicity of the stars is artificially kept to Z = 10−3 until presently (blue line) and when RGB mass loss is neglected (red). |
| In the text | |
|
Fig. 8. The comparison between the J luminosity functions obtained for the LMC (grey line) and the SMC (black). The red, dashed line indicates the results obtained for the SMC on the basis of the assumption that 1 − 1.3 M⊙ metal-poor stars experience a 0.3 M⊙ mass loss during the RGB evolution. |
| In the text | |
Current usage metrics show cumulative count of Article Views (full-text article views including HTML views, PDF and ePub downloads, according to the available data) and Abstracts Views on Vision4Press platform.
Data correspond to usage on the plateform after 2015. The current usage metrics is available 48-96 hours after online publication and is updated daily on week days.
Initial download of the metrics may take a while.