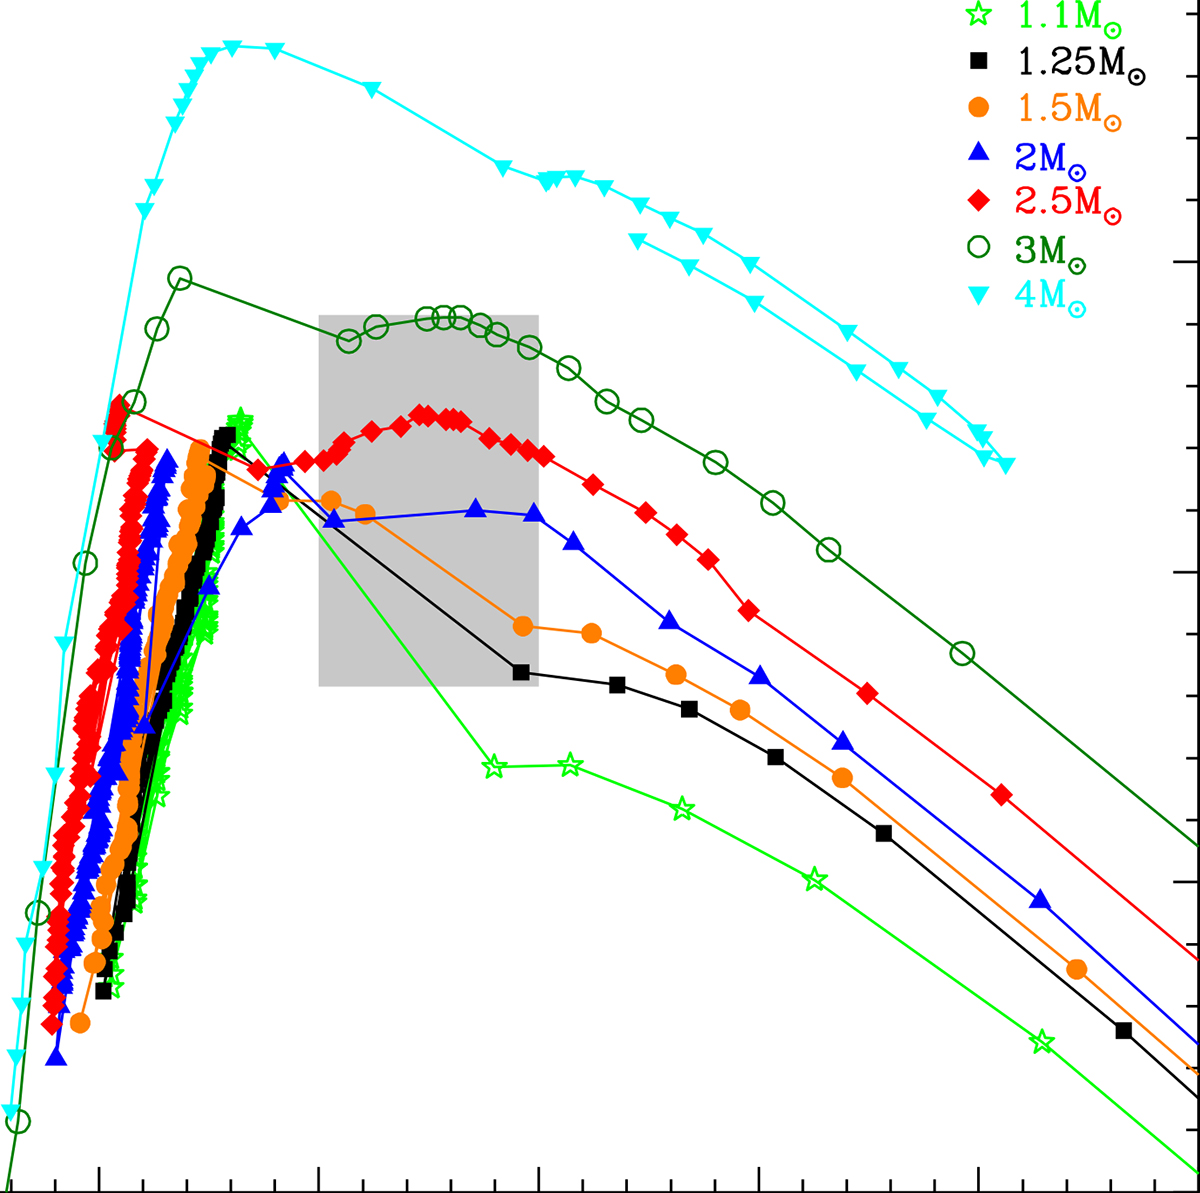
Fig. 3.
Download original image
Evolutionary tracks of model stars of metallicity Z = 8 × 10⁻³ on the (J − K, J) colour-magnitude diagram. The different points along the tracks refer to some selected evolutionary stages taken during the AGB phase, chosen in order to well represent the excursion of the tracks on the observational plane. The grey shaded region indicate the box chosen by Magnus et al. (2024) for the J region. The masses given for M < 1.5 M⊙ refer to the values attained at the TRGB.
Current usage metrics show cumulative count of Article Views (full-text article views including HTML views, PDF and ePub downloads, according to the available data) and Abstracts Views on Vision4Press platform.
Data correspond to usage on the plateform after 2015. The current usage metrics is available 48-96 hours after online publication and is updated daily on week days.
Initial download of the metrics may take a while.