Fig. 5.
Download original image
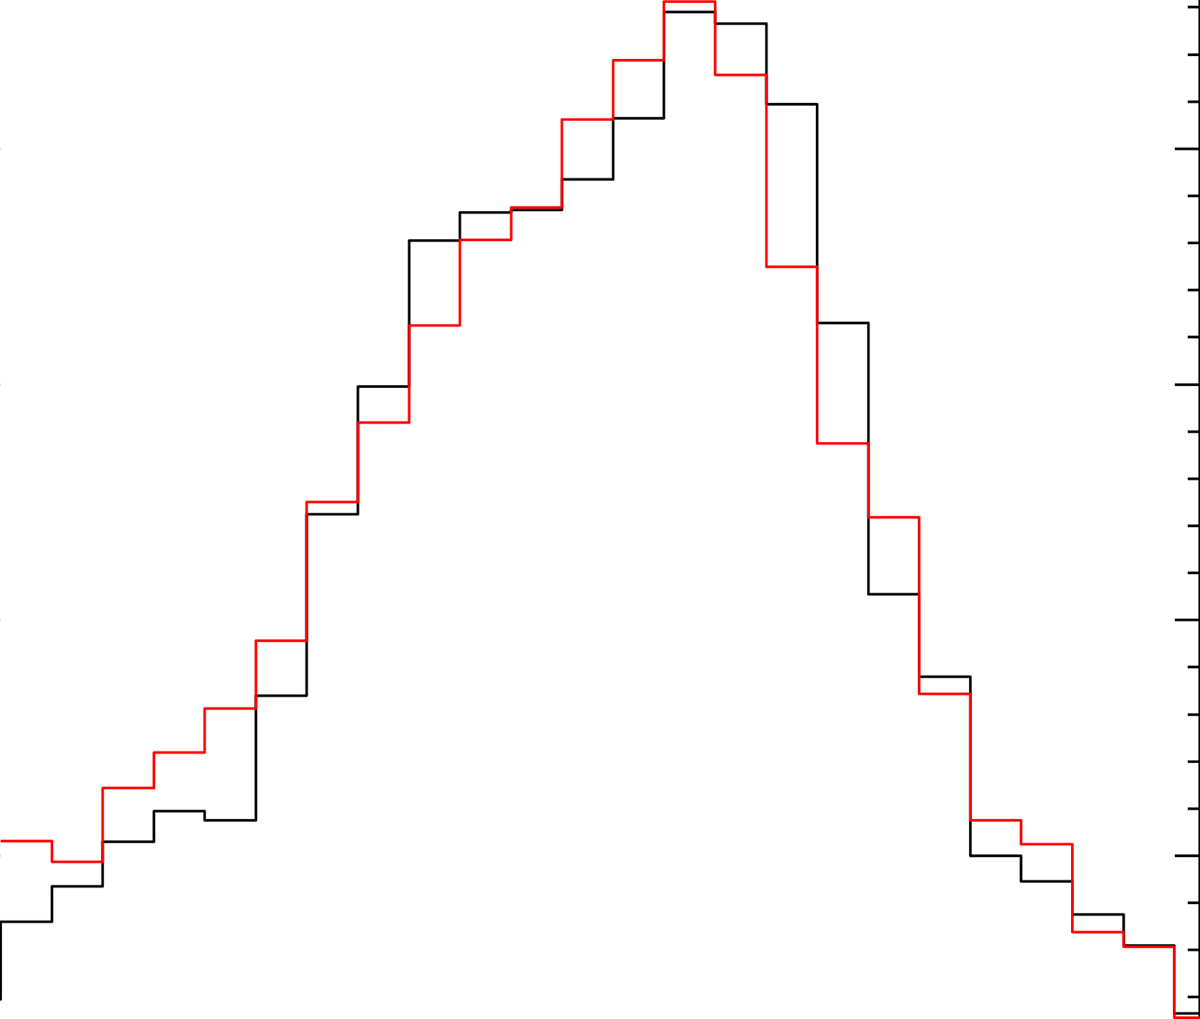
Left: The J luminosity function of the LMC AGB stars populating the J region of the (J − K, J) plane, obtained by means of population synthesis, is shown in black, and compared with the JLF by Magnus et al. (2024) (red line). Right: The distribution of the masses of the stars in the J region of the (J − K, J) plane, which correspond to the JLF shown in the left panel. The masses of M < 1.5 M⊙ stars refer to the values at the start of the core helium-burning phase.
Current usage metrics show cumulative count of Article Views (full-text article views including HTML views, PDF and ePub downloads, according to the available data) and Abstracts Views on Vision4Press platform.
Data correspond to usage on the plateform after 2015. The current usage metrics is available 48-96 hours after online publication and is updated daily on week days.
Initial download of the metrics may take a while.