Open Access
Fig. C.2
Download original image
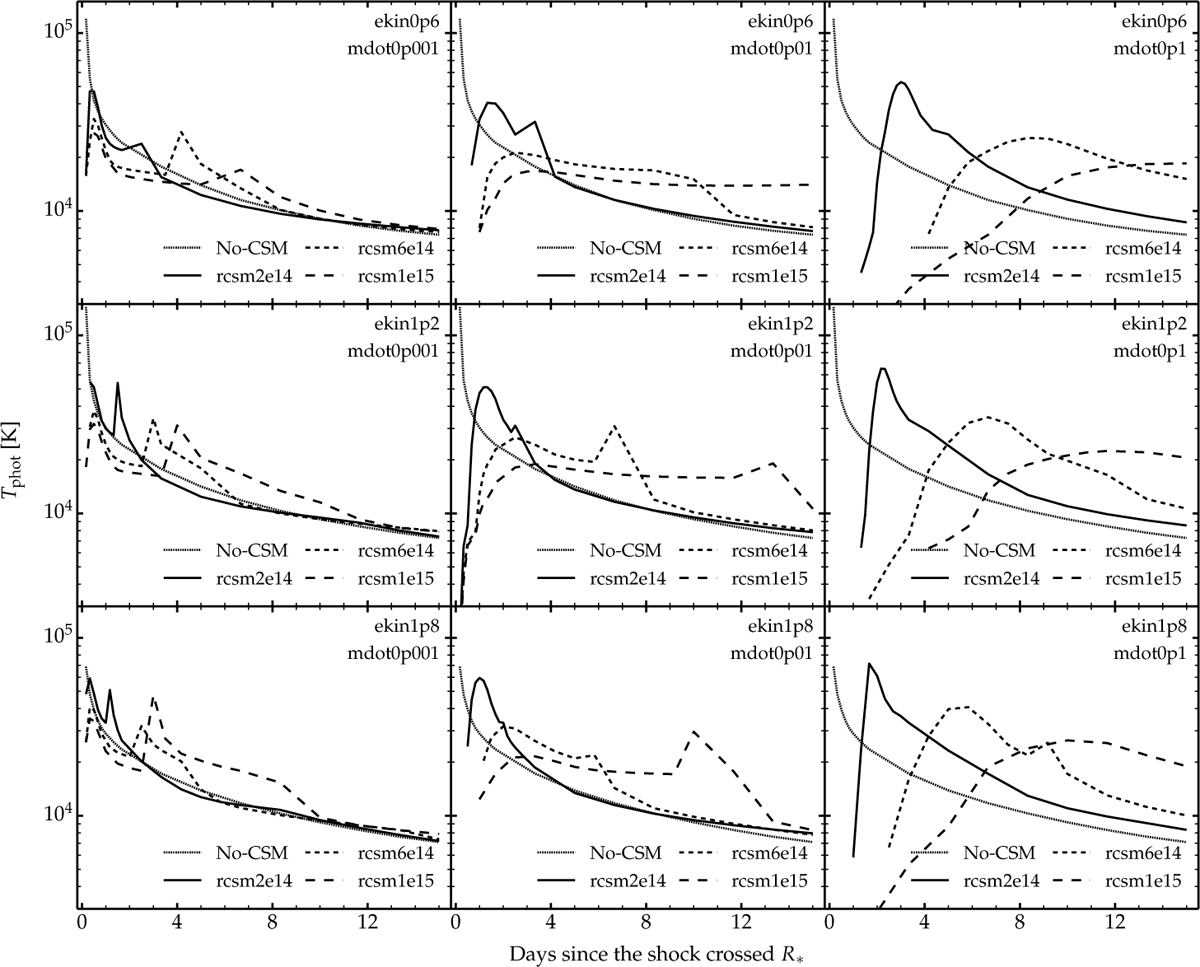
Counterpart of Fig. 3 showing the evolution of the photospheric temperature obtained with the multigroup radiation-hydrodynamics code HERACLES for our model set. The x-axis origin corresponds to the time when the shock crossed R∗.
Current usage metrics show cumulative count of Article Views (full-text article views including HTML views, PDF and ePub downloads, according to the available data) and Abstracts Views on Vision4Press platform.
Data correspond to usage on the plateform after 2015. The current usage metrics is available 48-96 hours after online publication and is updated daily on week days.
Initial download of the metrics may take a while.