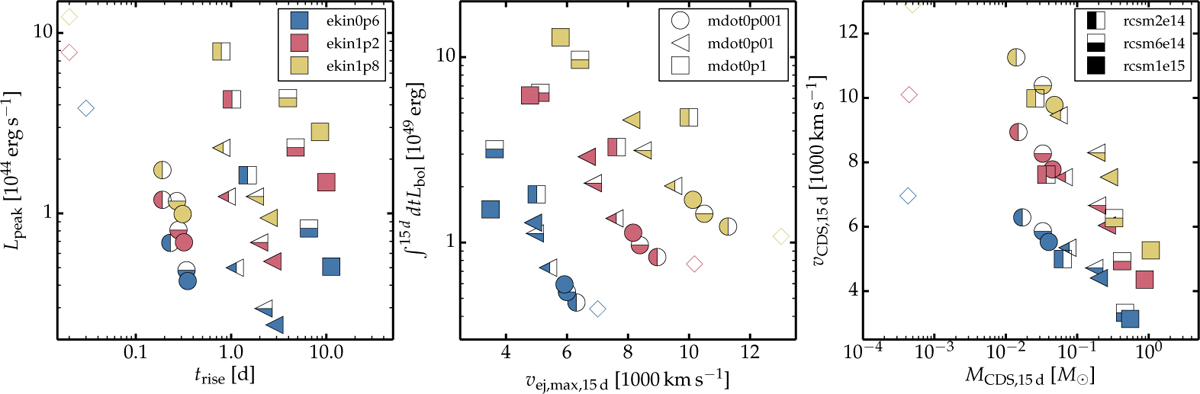
Fig. 2
Download original image
Results from the radiation-hydrodynamics calculations for our sample of 27 ejecta and CSM configurations. Left: peak luminosity vs. rise time to peak. Middle: Time-integrated bolometric luminosity vs. maximum ejecta velocity, both evaluated at 15 d. Right: CDS velocity vs. CDS mass at 15 d. The colors signify different model kinetic energies, the symbols show the mass-loss rate, and the filling style shows the CSM extent. These indications, which apply to all panels, are given separately, one panel at a time for better visibility. For comparison, we also show the results for the three No-CSM cases (empty diamonds). The interaction phase is not concluded in models with a high CSM mass and extent, so the values are not yet converged at 15 d in these cases.
Current usage metrics show cumulative count of Article Views (full-text article views including HTML views, PDF and ePub downloads, according to the available data) and Abstracts Views on Vision4Press platform.
Data correspond to usage on the plateform after 2015. The current usage metrics is available 48-96 hours after online publication and is updated daily on week days.
Initial download of the metrics may take a while.