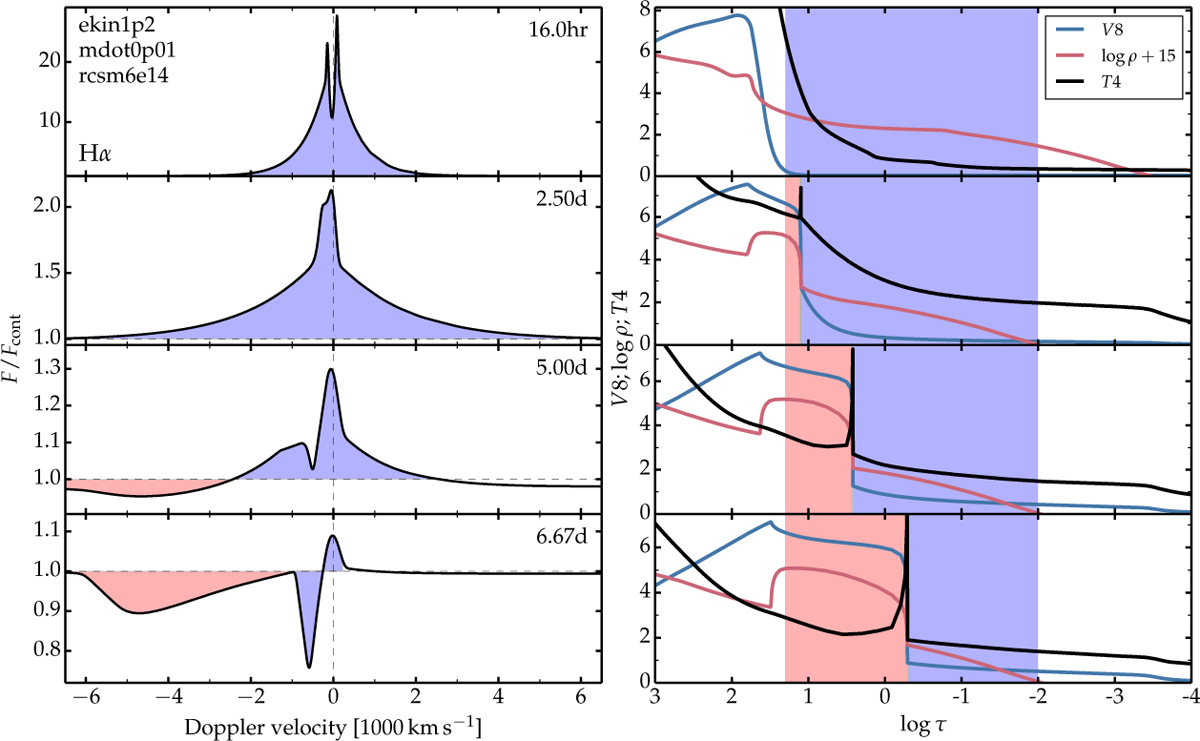
Fig. 6
Download original image
Correspondence between the Hα evolution (left column; only H I lines are included in the displayed range) and the dynamical properties in the spectrum formation region (right column) for model ekin1p2_mdot0p01_rcsm6e14. The shading differentiates emission from the unshocked CSM (blue) and the shocked material (red), which corresponds here to the dense shell. The spectrum forms preferentially over regions in which log τ is between −1 and 1, except for the narrow-line core arising from regions at log τ of about −2. Here, V8 refers to the velocity in units of 108 cm s−1 and T4 is the gas (or electron) temperature in units of 104 K (log ρ is the base-10 logarithm of the density, shown with an additive constant for better visibility).
Current usage metrics show cumulative count of Article Views (full-text article views including HTML views, PDF and ePub downloads, according to the available data) and Abstracts Views on Vision4Press platform.
Data correspond to usage on the plateform after 2015. The current usage metrics is available 48-96 hours after online publication and is updated daily on week days.
Initial download of the metrics may take a while.