Fig. 8
Download original image
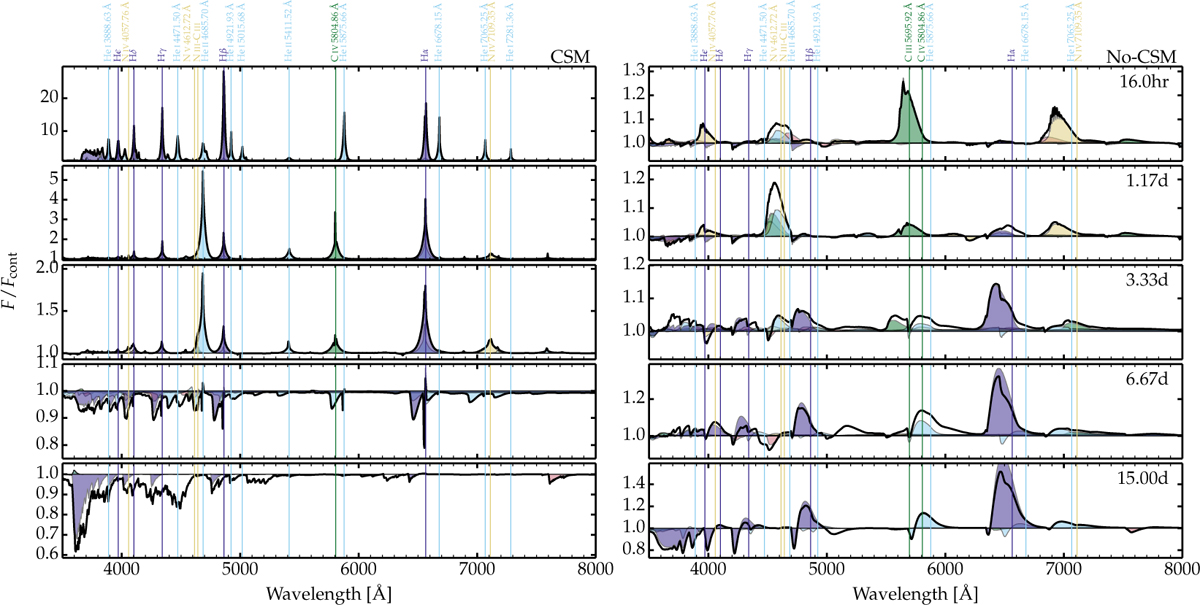
Comparison of the spectral evolution of model ekin1p2 with a CSM (left; case mdot0p01 and rcsm6e14) and without CSM (right). The rest wavelength of the main lines is indicated and is also color-coded to differentiate different species. The lines that are affected by Doppler broadening exhibit a strong blueshift and can primarily appear in absorption (later epochs in the CSM case during the CDS phase) or primarily in emission (No-CSM case). See Sect. 5.3 for a discussion.
Current usage metrics show cumulative count of Article Views (full-text article views including HTML views, PDF and ePub downloads, according to the available data) and Abstracts Views on Vision4Press platform.
Data correspond to usage on the plateform after 2015. The current usage metrics is available 48-96 hours after online publication and is updated daily on week days.
Initial download of the metrics may take a while.