Fig. B.1
Download original image
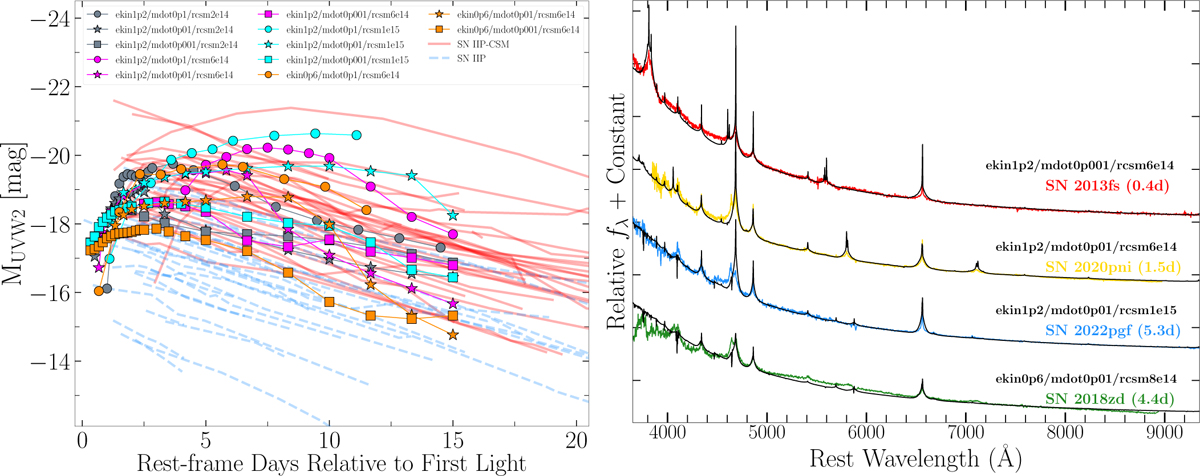
Left: Swift-UVOT UVW2 band light curves from Jacobson-Galán et al. (2024b) for SNe II with (solid red lines) and without (dashed blue lines) early-time IIn-like spectral features. Model light curves are shown for mass-loss rates of 0.1 M⊙yr−1 (circles), 0.01 M⊙ yr−1 (stars), and 0.001 M⊙yr−1 (squares). Varying model CSM radii of 2, 6, and 10 ×1014 cm shown as grey, magenta and cyan symbols. Low kinetic energy model (Ekin = 6 × 1050 erg) with varying mass-loss rates are shown as orange symbols. Right: Optical spectra of SNe 2013fs (red), 2020pni (yellow), 2022pgf (blue) and 2018zd (green) from the SN II sample compiled by Jacobson-Galán et al. (2024b) compared to best-match spectra (black) from current model grid at a similar phase. All models shown have consistent IIn timescales to the SNe being compared.
Current usage metrics show cumulative count of Article Views (full-text article views including HTML views, PDF and ePub downloads, according to the available data) and Abstracts Views on Vision4Press platform.
Data correspond to usage on the plateform after 2015. The current usage metrics is available 48-96 hours after online publication and is updated daily on week days.
Initial download of the metrics may take a while.