Fig. 5.
Download original image
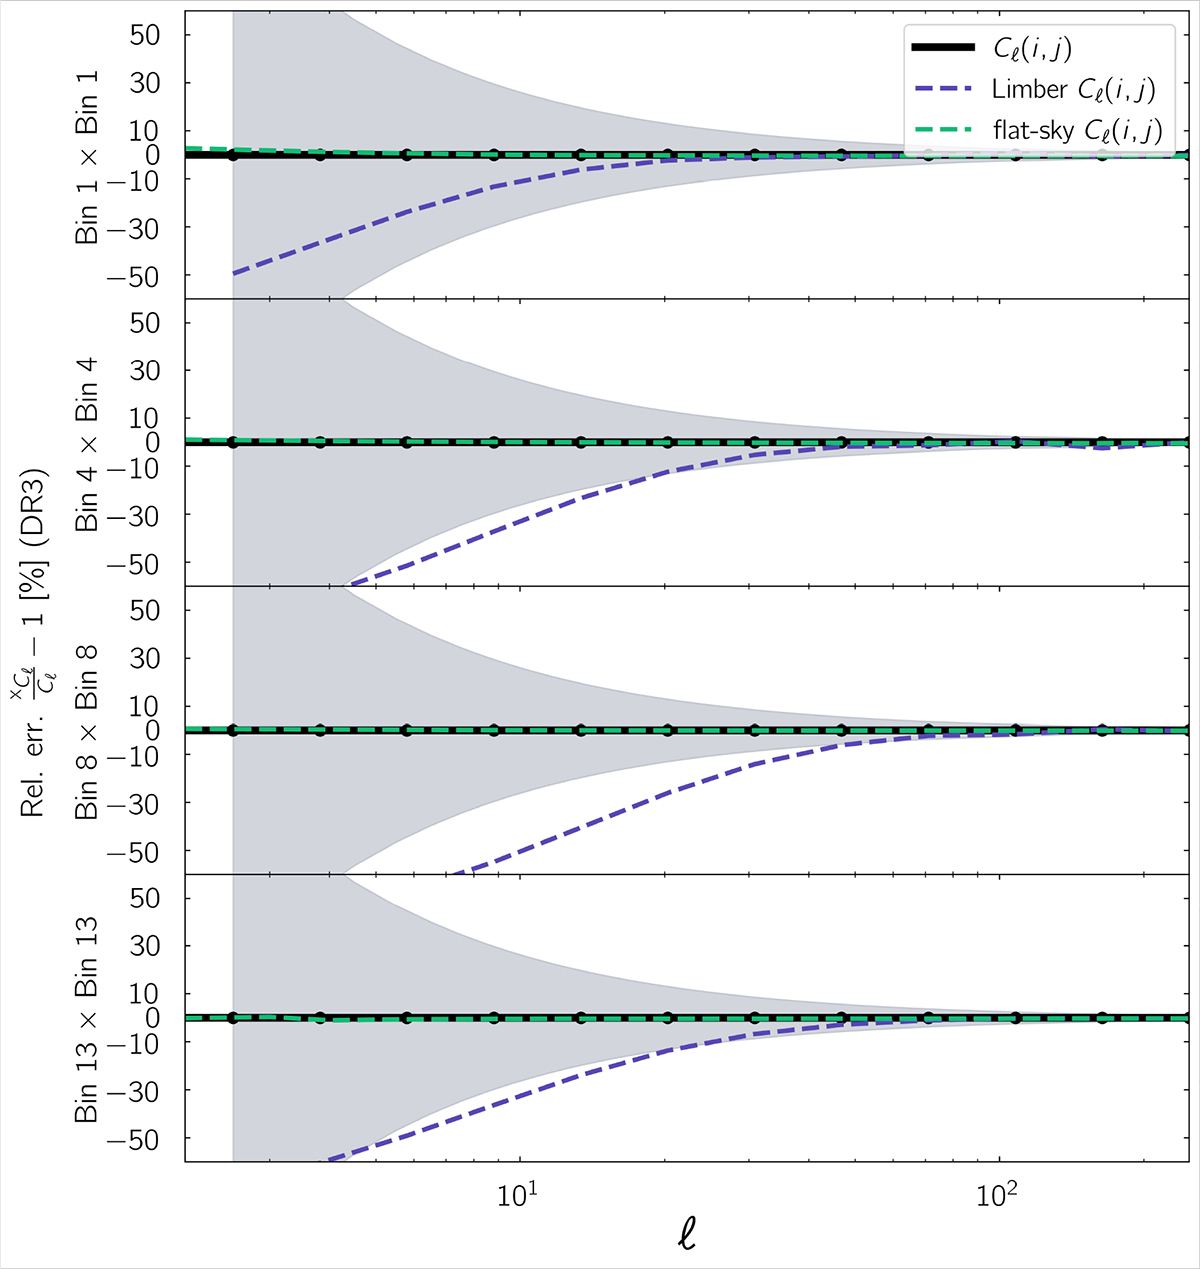
Relative errors in the equal redshift angular power spectrum for redshift bin 1, 4, 8, and 13 of Euclid, using 13 equi-populated bins (DR3). We show the full calculation result from CLASS as a black solid line, and the Limber approximation result as a purple dashed line. The green dashed line corresponds to the recalibrated version of the flat-sky approximation. The relative error associated with the Gaussian covariance calculated at 1σ for the given survey configuration is shown as the grey contour. We note that the y-axis ranges are [ − 50, 50], in contrast to Figs. 2 and 3.
Current usage metrics show cumulative count of Article Views (full-text article views including HTML views, PDF and ePub downloads, according to the available data) and Abstracts Views on Vision4Press platform.
Data correspond to usage on the plateform after 2015. The current usage metrics is available 48-96 hours after online publication and is updated daily on week days.
Initial download of the metrics may take a while.