Fig. 7.
Download original image
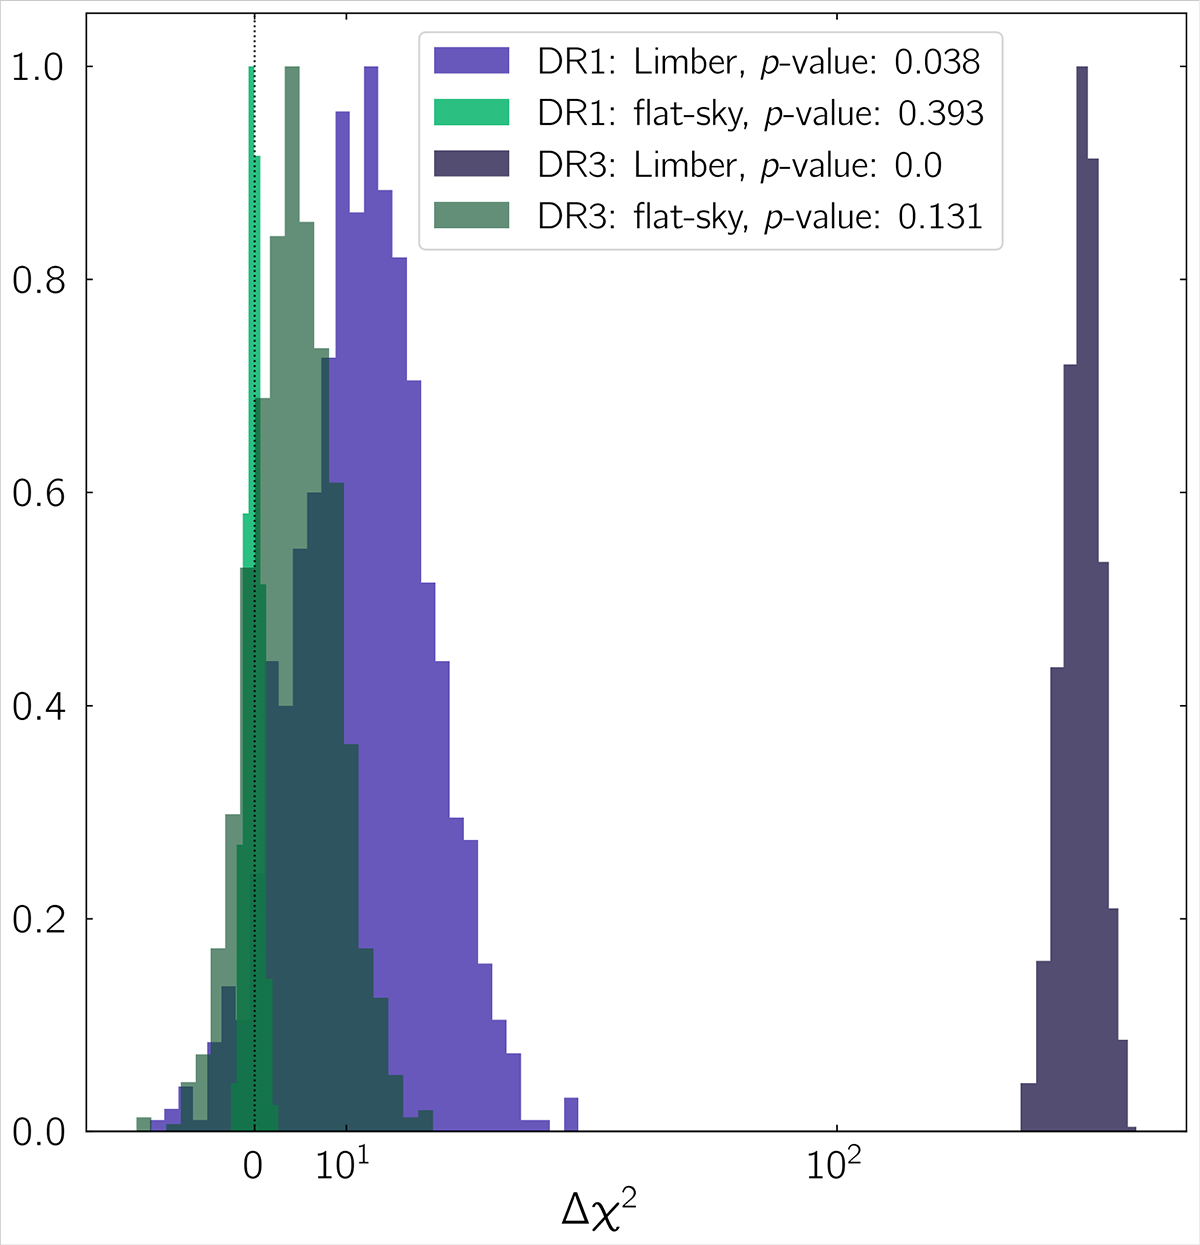
The Δχ2 frequency distributions of the flat-sky (green) and Limber (purple) approximations compared to the full result, with the spread provided by the Gaussian covariance for each survey configuration. The DR1 bin configuration is shown in lighter colours, while the eventual DR3 bin result is shown in darker colours. The improvement of the flat-sky over the Limber approximation is seen in the closer proximity of the former’s distribution to the dotted vertical black line at Δχ2 = 0, most notable in the DR3 bin case. The histograms are each normalised to their own peak values and the x-axis is log-scaled above Δχ2 = 50.
Current usage metrics show cumulative count of Article Views (full-text article views including HTML views, PDF and ePub downloads, according to the available data) and Abstracts Views on Vision4Press platform.
Data correspond to usage on the plateform after 2015. The current usage metrics is available 48-96 hours after online publication and is updated daily on week days.
Initial download of the metrics may take a while.