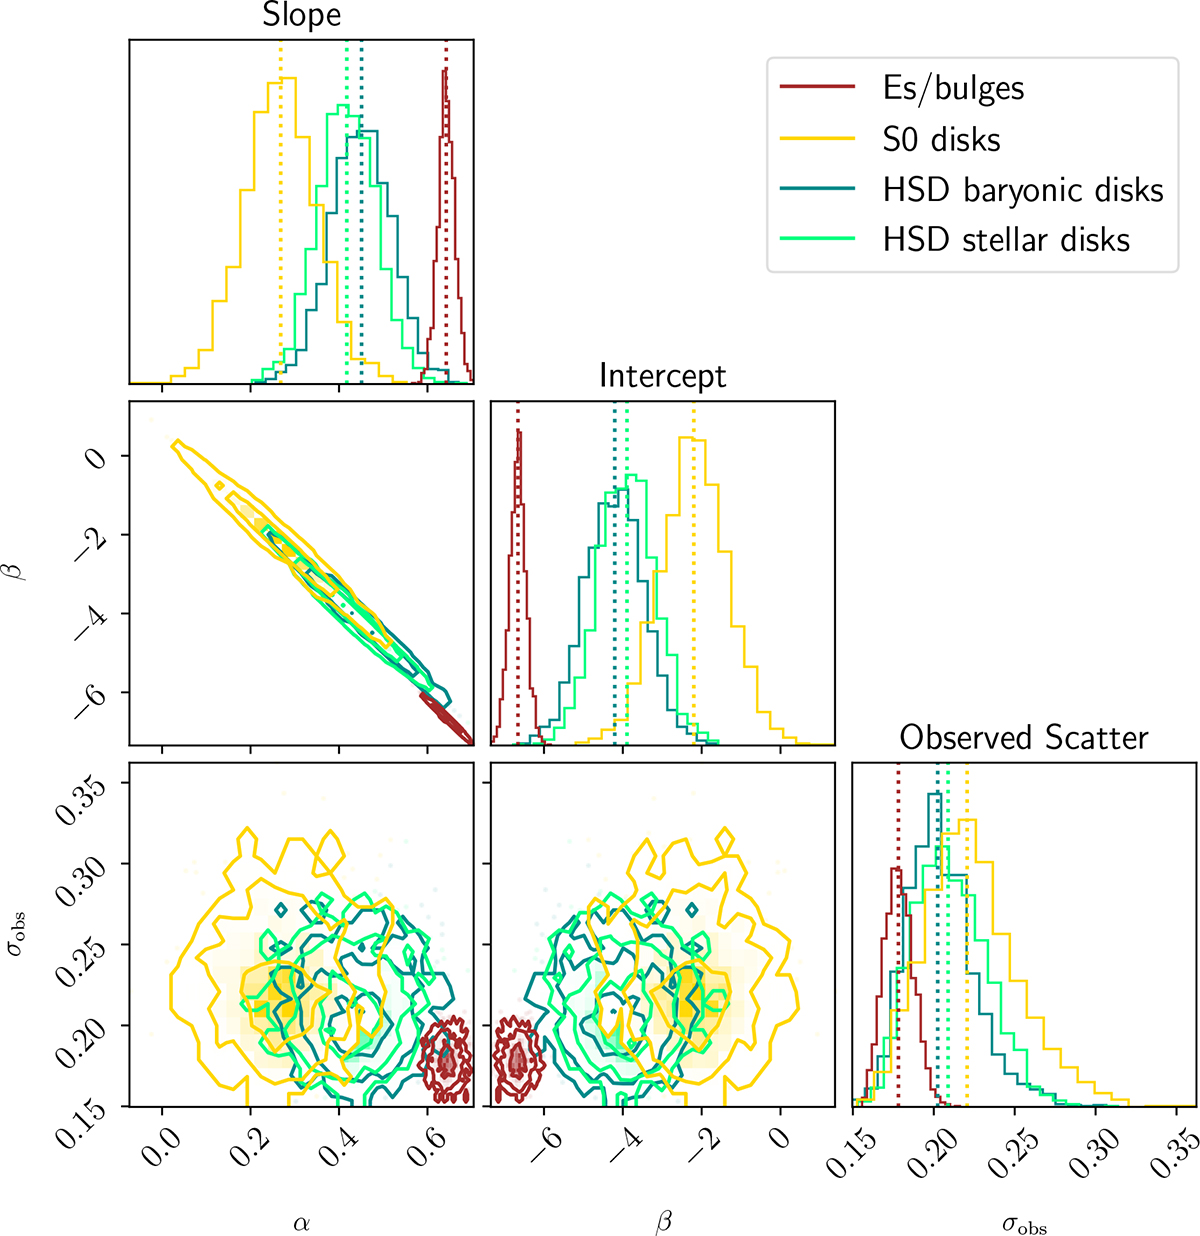
Fig. 2.
Download original image
Corner plots of the mass–size relations of Es and bulges, S0 disks, HSD baryonic disks, and HSD stellar disks. The panels show the 2D posterior probability distributions of pairs of fitting parameters, and the 1D marginalised probability distribution of each fitting parameter (histograms). In the 2D distributions, the contours correspond to the 1σ, 2σ, and 3σ regions, respectively. In the histograms, the dashed lines correspond to the median values.
Current usage metrics show cumulative count of Article Views (full-text article views including HTML views, PDF and ePub downloads, according to the available data) and Abstracts Views on Vision4Press platform.
Data correspond to usage on the plateform after 2015. The current usage metrics is available 48-96 hours after online publication and is updated daily on week days.
Initial download of the metrics may take a while.