| Issue |
A&A
Volume 707, March 2026
|
|
|---|---|---|
| Article Number | A292 | |
| Number of page(s) | 12 | |
| Section | Extragalactic astronomy | |
| DOI | https://doi.org/10.1051/0004-6361/202557777 | |
| Published online | 16 March 2026 | |
The baryonic mass–size relation of galaxies
II. Implications for the evolutionary paths between star-forming and passive galaxies
1
Arcetri Astrophysical Observatory, INAF, Largo Enrico Fermi 5, 50125 Florence, Italy
2
Department of Astronomy, University of Science and Technology of China, Hefei 230026, China
3
School of Astronomy and Space Sciences, University of Science and Technology of China, Hefei 230026, China
4
Dipartimento di Fisica e Astronomia, Università degli Studi di Firenze, 50019 Sesto Fiorentino, Italy
5
Department of Astronomy, Case Western Reserve University, 10900 Euclid Avenue, Cleveland, OH 44106, USA
6
Department of Physics, University of Oregon, Eugene, OR 97403, USA
★ Corresponding author: This email address is being protected from spambots. You need JavaScript enabled to view it.
Received:
20
October
2025
Accepted:
15
January
2026
Abstract
The baryonic mass–size relation of galaxies links the total baryonic mass (stars plus gas) to the baryonic half-mass radius. In the first paper of this series, we showed that star-forming galaxies from the SPARC sample follow two distinct relations in the baryonic mass–size plane: one defined by high-surface-density (HSD), star-dominated, Sa-to-Sc galaxies, and one defined by low-surface-density (LSD), gas-dominated, Sd-to-dI galaxies. In this second paper, we study the structural relations between baryonic mass, half-mass radius, and mean surface density to constrain possible morphological transformations between star-forming and passive galaxies. We complemented the SPARC sample with ∼1200 passive galaxies that are nearly devoid of gas: ellipticals (Es), lenticulars (S0s), dwarf ellipticals (dEs) or dwarf spheroidals (dSphs), and the so-called ‘ultra-diffuse galaxies’ (UDGs). Our results can be summarised as follows: (1) passive stellar components follow four distinct relations at high statistical significance, namely (i) Es plus bulges, (ii) S0 disks, (iii) non-nucleated dwarfs (dEs, dSphs, and UDGs), and (iv) nucleated dEs. (2) Star-forming HSD disks (mostly Sa to Sc) overlap with S0 disks within 2σ in the baryonic relations and within 1σ in the stellar ones, so present-day spirals may simply evolve into S0s as they run out of gas. (3) Star-forming LSD disks (mostly Sd to dI) are offset from non-nucleated passive dwarfs by more than 3σ in the baryonic relations, but the two galaxy populations overlap within 1σ in the stellar relations, suggesting that non-nucleated passive dwarfs can form from star-forming dwarfs only after gas removal. (4) UDGs extend the sequence of non-nucleated dEs/dSphs and may originate from the most diffuse star-forming LSD galaxies with no need for a substantial expansion of the stellar component.
Key words: galaxies: dwarf / galaxies: elliptical and lenticular / cD / galaxies: evolution / galaxies: spiral / galaxies: structure
© The Authors 2026
 Open Access article, published by EDP Sciences, under the terms of the Creative Commons Attribution License (https://creativecommons.org/licenses/by/4.0), which permits unrestricted use, distribution, and reproduction in any medium, provided the original work is properly cited.
This article is published in open access under the Subscribe to Open model. This email address is being protected from spambots. You need JavaScript enabled to view it. to support open access publication.
1. Introduction
A classic approach to investigating the formation and evolution of galaxies is studying the structural relationships between their total luminosity (or total stellar mass, M★), half-light radius (or half-mass radius, R50, ★), and mean surface brightness (or mean stellar surface density, Σ★ = M★/2πR50, ★2). For example, passive ‘quenched’ galaxies in galaxy clusters follow different luminosity−size−surface brightness relationships (e.g. Kormendy 1985; Binggeli & Cameron 1991; Binggeli 1994): one set by giant ellipticals (Es) and one by dwarf ellipticals (dEs). This fact indicates that dEs are not a ‘miniature’ version of giant Es, despite their similar morphology and resulting historical nomenclature. Rather, dEs follow the same structural relations as dimmer dwarf spheroidals (dSphs) in the Local Group and in other nearby groups. This evidence led Kormendy et al. (2009) to rename passive dwarfs (dEs or dSphs) ‘spheroidals’ in contrast to proper ‘ellipticals’. In this paper, we use the historical nomenclature dEs/dSphs, but there is no clear-cut distinction between dEs and dSphs. In addition, Kormendy & Bender (2012) proposed a revised Hubble tuning fork (following early ideas of van den Bergh 1976) in which passive lenticulars (S0s) with different bulge-to-disk ratios (S0a, S0b, and S0c) form a parallel sequence to the classic one of star-forming spirals (Sa, Sb, and Sc). At the end of this revised Hubble sequence, there are ‘bulgeless’ low-mass galaxies: dSphs/dEs on the passive branch and dwarf irregulars (dIs) on the star-forming branch.
In the first paper of this series (Hua et al. 2025, hereafter Paper I), we introduced the baryonic mass–size relation of galaxies, which links the total baryonic mass (Mbar = M★ + Mgas) to the baryonic half-mass radius (R50, bar), enclosing half of Mbar. In passive galaxies (Es, S0s, and dEs/dSphs), the gas mass (Mgas) is often negligible (but see Serra et al. 2012), so the baryonic mass–size plane is equivalent to the ‘classic’ stellar mass–size plane. The situation is very different for star-forming galaxies, especially for dwarf galaxies in which Mgas can be much higher than M★ (e.g. Lelli 2022). In Paper I, we found that star-forming galaxies follow two distinct sequences in the Mbar − R50, bar plane: one defined by star-dominated, high-surface-density (HSD) galaxies (mostly Sa to Sc) and one by gas-dominated, low-surface-density (LSD) galaxies (mostly Sd to dI). These two sequences were previously found in the luminosity-size plane by Schombert (2006) and are reminiscent of the dichotomy between high-mass passive galaxies (Es and S0s) and low-mass ones (dEs and dSphs).
In this second paper, we constrain the possible morphological transformations between star-forming and passive galaxies by studying the structural relations between the baryonic quantities Mbar, R50, bar, and Σ50, bar = M50, bar/2πR50, bar2, as well as the stellar quantities M★, R50, ★, and Σ50, ★. The basic idea is simple. If a galaxy converts its gas into stars in a close-box fashion, it will move across the stellar relations but stay nearly at the same location of the baryonic ones (apart from minor variations in R50, bar depending on where the star formation occurs). Instead, if a galaxy suddenly loses its gas, it will move across the baryonic relations but stay almost at the same location of the stellar ones, unless the gas loss occurs together with a significant change in the stellar distribution. This simple idea provides key insights into galaxy evolution, especially in the dwarf regime where the gas content can be either totally dominant or totally negligible.
This paper is structured as follows. In Sect. 2 we describe our galaxy sample and data analysis. In Sect. 3 we present the baryonic structural relations for passive and star-forming galaxies. In Sect. 4 we discuss our results in terms of galaxy formation and evolution. In Sect. 5 we provide a brief summary.
2. Datasets
For star-forming galaxies, we used the same sample as in Paper I, which consists of 169 galaxies (Sa to dI) from the Spitzer Photometry & Accurate Rotation Curves (SPARC, Lelli et al. 2016) database. For the derivation of Mbar and R50, bar, we refer to Paper I. We just recall that stellar masses are measured using Spitzer photometry at 3.6 μm and assuming a mass-to-light ratio (![Mathematical equation: $ \Upsilon_{\star}^{[3.6]} $](/articles/aa/full_html/2026/03/aa57777-25/aa57777-25-eq1.gif) ) of 0.5 for the stellar disk and 0.7 for the stellar bulge. These values were derived using the stellar population synthesis (SPS) models by Schombert & McGaugh (2014) and subsequent improvements by Schombert et al. (2019), assuming the Chabrier (2003) initial mass function (IMF) and the chemical-enrichment model of Prantzos(2009). Variations in Υ★ from galaxy to galaxy are taken into account in the error budget, assuming a scatter of 25%. Recent studies (e.g. Schombert et al. 2022) show that the Υ★[3.6] of LSD disks might be smaller (∼0.4 on average) than that of HSD disks (∼0.5 on average) due to differences in their star-formation and chemical enrichment histories (see Fig. 1 of Schombert et al. 2022). However, such a small difference in
) of 0.5 for the stellar disk and 0.7 for the stellar bulge. These values were derived using the stellar population synthesis (SPS) models by Schombert & McGaugh (2014) and subsequent improvements by Schombert et al. (2019), assuming the Chabrier (2003) initial mass function (IMF) and the chemical-enrichment model of Prantzos(2009). Variations in Υ★ from galaxy to galaxy are taken into account in the error budget, assuming a scatter of 25%. Recent studies (e.g. Schombert et al. 2022) show that the Υ★[3.6] of LSD disks might be smaller (∼0.4 on average) than that of HSD disks (∼0.5 on average) due to differences in their star-formation and chemical enrichment histories (see Fig. 1 of Schombert et al. 2022). However, such a small difference in ![Mathematical equation: $ \Upsilon_{\star}^{[3.6]} $](/articles/aa/full_html/2026/03/aa57777-25/aa57777-25-eq2.gif) has a negligible effect on our final results because the variation in M★ is smaller than the uncertainties.
has a negligible effect on our final results because the variation in M★ is smaller than the uncertainties.
In the following, we describe the data collection for passive galaxies with no substantial star-formation activity (Es, S0s, dEs/dSphs, and ultra-diffuse galaxies). Even if these galaxies are not forming stars at a substantial rate, some of them may contain atomic and/or molecular gas (e.g. Serra et al. 2012; Shelest & Lelli 2020). However, the gas fraction is generally very small (Mgas/Mbar ≲ 0.01), so we neglect any gas contribution and assume that Mbar ≃ M★ and R50, bar ≃ R50, ★ to a first-order approximation.
2.1. Ellipticals and lenticulars
We considered 140 Es from Schombert (2016) that have Spitzer images at 3.6 μm. This dataset is fully consistent with the SPARC dataset in terms of photometric band and photometric procedures. To derive M★, we adopted ![Mathematical equation: $ \Upsilon_{\star}^{[3.6]} = 0.9 $](/articles/aa/full_html/2026/03/aa57777-25/aa57777-25-eq3.gif) M⊙/L⊙ (Lelli et al. 2017; Schombert et al. 2022). This value comes from the same SPS models that set M★ for SPARC galaxies, so the two datasets are on a common stellar mass scale. The difference in
M⊙/L⊙ (Lelli et al. 2017; Schombert et al. 2022). This value comes from the same SPS models that set M★ for SPARC galaxies, so the two datasets are on a common stellar mass scale. The difference in ![Mathematical equation: $ \Upsilon_{\star}^{[3.6]} $](/articles/aa/full_html/2026/03/aa57777-25/aa57777-25-eq4.gif) between elliptical and star-forming galaxies is largely driven by differences in their star-formation and chemical-enrichment histories (e.g. Schombert et al. 2022).
between elliptical and star-forming galaxies is largely driven by differences in their star-formation and chemical-enrichment histories (e.g. Schombert et al. 2022).
In addition, we built a sample of 33 lenticulars (S0s) that have available bulge-disk decompositions from the literature:
-
Sixteen S0s from Lelli et al. (2017) with Spitzer images at 3.6 μm. To derive M★, we adopted
![Mathematical equation: $ \Upsilon_{\mathrm{bul}}^{[3.6]} = \Upsilon_{\mathrm{disk}}^{[3.6]} = 0.8 $](/articles/aa/full_html/2026/03/aa57777-25/aa57777-25-eq5.gif) M⊙/L⊙ (Lelli et al. 2017). This value comes from the same SPS models that set M★ for SPARC galaxies, so the datasets are on the same stellar-mass scale.
M⊙/L⊙ (Lelli et al. 2017). This value comes from the same SPS models that set M★ for SPARC galaxies, so the datasets are on the same stellar-mass scale. -
Ten S0s from Rizzo et al. (2018). This work provides three different estimates of M★. For consistency with the SPARC sample, we used M★ from the K-band luminosity assuming H0 = 73 km s−1 Mpc−1 and
 for both the bulges and the disks. This value is consistent with the SPARC stellar-mass scale because
 ![Mathematical equation: $ \Upsilon^{\mathrm{K}}_{\star}\simeq1.29 \Upsilon^{[3.6]}_\star $](/articles/aa/full_html/2026/03/aa57777-25/aa57777-25-eq7.gif) with no significant colour term (McGaugh & Schombert 2014), so Υ★[3.6] = 0.8 translates to Υ★K ≃ 1.0. The uncertainties in M★ from K-band data are dominated by galaxy-to-galaxy variations in Υ★K and are comparable to those from [3.6] data. To derive Mbul and Mdisk separately, we used the r−band B/T from Rizzo et al. (2018). R50, bul and R50, disk were estimated with a parametric decomposition in the r band in the manner described by Rizzo et al. (2018).
with no significant colour term (McGaugh & Schombert 2014), so Υ★[3.6] = 0.8 translates to Υ★K ≃ 1.0. The uncertainties in M★ from K-band data are dominated by galaxy-to-galaxy variations in Υ★K and are comparable to those from [3.6] data. To derive Mbul and Mdisk separately, we used the r−band B/T from Rizzo et al. (2018). R50, bul and R50, disk were estimated with a parametric decomposition in the r band in the manner described by Rizzo et al. (2018). -
Seven S0s from Kormendy & Bender (2012). Specifically, we selected only S0s with ‘classical bulges’ to be consistent with the SPARC non-parametric bulge-disk decompositions, which assigned ‘pseudo-bulges’ to the disk component (see Lelli et al. 2016). Kormendy & Bender (2012) provided the V−band absolute magnitude, so we computed Mbul and Mdisk assuming
 M⊙/L⊙ in the V band (Schombert et al. 2022). This value comes from the same SPS models that set M★ in SPARC galaxies, so the galaxies are on a common stellar-mass scale, but the uncertainties in M★ from V-band data are significantly larger than those from [3.6] or K-band data.
2.2. Dwarf ellipticals and dwarf spheroidals
We considered passive dwarfs (dEs/dSphs) in the core regions of galaxy clusters, so we can assume that they are largely devoid of gas. In particular, we considered galaxies with available photometry from the following surveys:
-
404 galaxies from the Next Generation Virgo Cluster Survey (NGVS, Ferrarese et al. 2020). These galaxies were identified as members of the Virgo cluster via visual inspections (Ferrarese et al. 2020), so they are the most reliable. R50, ★ was derived from the curve of growth based on the g−band surface brightness profiles.
-
627 galaxies from the Next Generation Fornax Cluster Survey (NGFS), specifically 243 from Eigenthaler et al. (2018) and 384 from Ordenes-Briceño et al. (2018). R50, ★ was estimated from i−band images.
Given the availability of i and g magnitudes, we calculated stellar masses using the relation from Taylor et al. (2011):
 (1)
(1)
Equation (1) is based on the Chabrier (2003) IMF and the SPS models of Bruzual & Charlot (2003). For low-mass galaxies with typical colours, M★ estimated by Eq. (1) is virtually the same as the one by Schombert & McGaugh (2014, see also Fig. 3 of Schombert et al. 2022). Therefore, the stellar masses of these passive dwarfs are on the same mass scale as SPARC galaxies. The catalogue from Ordenes-Briceño et al. (2018) does not provide (g − i) values, so for these 384 dwarfs we assumed (g − i) = 0.85, which is the average colour of dEs/dSphs from Eigenthaler et al. (2018).
We excluded six galaxies from the NGVS (Ferrarese et al. 2020) because they have M★ > 1010 M⊙ and are morphologically classified as Es or S0s. The stellar masses of these galaxies would be even larger using the SPS models of Schombert & McGaugh (2014), which give higher Υ★ than Eq. (1) for the red colours typical of Es and S0s. Thus, we are confident that these objects are not dwarf galaxies. We did not consider them in our sample of Es and S0s, for the sake of internal consistency: all the Es in our sample have Spitzer data, while all the lenticulars have accurate bulge-disk decompositions.
Finally, we added nine galaxies from Kormendy et al. (2009) and one from Kormendy & Bender (2012), which are not included in the NGVS and NGFS catalogues. These galaxies are relatively massive dEs with M★ ≃ 109 M⊙ and occupy the interesting region connecting the sequences of dEs and Es. We computed their stellar mass assuming  M⊙/L⊙ in the V band. This value is motivated by studies of resolved stellar populations in nearby dEs/dSphs and puts them on the same stellar-mass scale as SPARC galaxies (Lelli et al. 2017). Indeed, these nine dEs/dSphs with M★ from V-band images do not show any systematics with respect to those with M★ from g-band images. In conclusion, our final sample of dEs/dSphs contains 1034 galaxies.
2.3. Ultra-diffuse galaxies
The term ‘ultra-diffuse galaxies’ (UDGs) was introduced by van Dokkum et al. (2015) to describe galaxies with central surface brightnesses lower than 24.5 mag arcsec−2 in the g band and effective radii larger than 1.5 kpc. It is debated whether UDGs are a new type of galaxy (such as ‘failed L★ galaxies’, van Dokkum et al. 2015), or merely the extension of the usual dwarf galaxies to lower surface brightnesses (e.g. Conselice 2018; Chilingarian et al. 2019; Iodice et al. 2020; Marleau et al. 2021; Rong et al. 2017, 2024; Li et al. 2023; Wright et al. 2021; Zöller et al. 2024; Lelli 2024). In the following, we use the term ‘UDGs’ to simply distinguish them from the historical population of dEs/dSphs.
We considered 46 UDGs in the Coma cluster (van Dokkum et al. 2015) and 21 UDGs in other clusters, as compiled by Gannon et al. (2024). These cluster UDGs can be assumed to be devoid of gas such that Mbar ≃ M★ and R50, bar ≃ R50, ★. For the UDGs in Coma, R50, ★ was measured from g−band images and M★ was derived using Eq. (1) with g − i = 0.8 (van Dokkum et al. 2015), similarly to usual dEs/dSphs. For the UDGs from Gannon et al. (2024), both R50, ★ and M★ were taken directly from their catalogue. The data from Gannon et al. (2024) are approximately on the same mass scale as the rest of our sample, showing no strong systematics.
3. Results
In this section we present the ‘structural planes’ between the baryonic mass, Mbar, half-mass radius, R50, bar, and mean surface density within the half-mass radius, Σ50, bar. Firstly, we discuss passive galaxies for which the baryonic and stellar quantities are virtually the same (Fig. 1), so we largely revisit known observational evidence. Subsequently, we discuss star-forming galaxies considering both their baryonic and stellar quantities (Figs. 4 and 5, respectively).
The various structural relations followed by different galaxy populations were fitted using the ROXY package (Bartlett & Desmond 2023), which performs a Bayesian linear fit using a Markov chain Monte Carlo technique (see Appendix A for technical details). The fit results are summarised in Table A.1. Posterior probability distributions of the fitting parameters are shown for the mass–size relations (Figs. 2 and 3).
3.1. Passive galaxies
3.1.1. Confirming the E−dE dichotomy
Figure 1 shows the structural relations of passive galaxies (Es, S0s, dEs/dSphs, and UDGs). The bulges and disks of S0s are considered to be separate components. We also add the bulges of spiral galaxies, which can be considered passive spheroids. In particular, we recall that the bulge-disk decompositions from the SPARC dataset (Lelli et al. 2016) consider only ‘classical’ bulges (mostly found in Sa-Sb) and assign other structures (bars, bar lenses, and pseudo-bulges) to the stellar disk because of their common origin and similar Υ★.
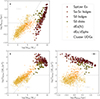 |
Fig. 1. Baryonic structural relations for passive galaxies: Mbar vs. R50, bar (top left), Mbar vs. Σ50, bar (bottom left), and R50, bar vs. Σbar vs. (bottom right). See Sect. 2 for references to the various datasets of Es, S0s, dEs/dSphs, and UDGs. We also considered the ‘classical’ bulges of Sa-Sc galaxies. The mean uncertainties of our sample galaxies are indicated in the top corner of each panel. For all these objects, the baryonic structural relations are virtually the same as the stellar ones. The dashed grey lines show the selection criteria of UDGs from van Dokkum et al. (2015). |
The dichotomy between Es and dEs/dSphs (Kormendy 1985; Binggeli & Cameron 1991) is evident. In the stellar or baryonic planes, the dichotomy is more emphasised than in the photometric planes (cf. with Kormendy et al. 2009) because Es tend to have higher Υ★ than dEs/dSphs. Stellar bulges form a continuous sequence with Es but are distinct from dEs/dSphs, in agreement with previous studies (Kormendy et al. 2009; Kormendy & Bender 2012). There exists a rarer population of ‘bright’ dEs that connects the two sequences at log(M★/ M⊙)≃9 − 10 and Σ50, bar ≃ 100 − 100 M⊙ pc−2 (see also Graham & Guzmán 2003; Gavazzi et al. 2005). The key point of the E-dE dichotomy, however, is not the presence (or absence) of a gap in the structural planes, but the fact that Es/bulges and dEs/dSphs follow relationships with different slopes. Indeed, we find that Es and bulges share similar slopes of ∼0.6, while dEs/dSphs have slopes of ∼0.2 − 0.3 (see Table A.1, Fig. 2 and Fig. 3). Some authors have proposed that passive galaxies form a continuous but non-monotonic sequence in the stellar mass–size plane (e.g. Eigenthaler et al. 2018); the change in slope must then correspond to different physical regimes where different processes are at play.
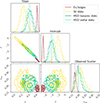 |
Fig. 2. Corner plots of the mass–size relations of Es and bulges, S0 disks, HSD baryonic disks, and HSD stellar disks. The panels show the 2D posterior probability distributions of pairs of fitting parameters, and the 1D marginalised probability distribution of each fitting parameter (histograms). In the 2D distributions, the contours correspond to the 1σ, 2σ, and 3σ regions, respectively. In the histograms, the dashed lines correspond to the median values. |
There are three dEs/dSphs from NGVS (Ferrarese et al. 2020) towards the bottom of the Es+bulge sequence. These three galaxies were classified as Es by Kormendy et al. (2009); we included them in the dEs/dSphs sample just to keep them distinct from the Spitzer Es from Schombert (2016). Based on their structural properties, these three galaxies appear to be similar to ‘compact ellipticals’ such as M32. The astronomical jargon here may become very confusing: ‘compact ellipticals’ extend the elliptical sequence to low masses, so one may be tempted to call them ‘dwarf ellipticals’, but the name dEs has historically been used to refer to low-mass galaxies on the other sequence (the ‘dwarf sequence’, following Binggeli 1994). Arguably, the nomenclature ‘Es’ versus ‘Sphs’ advocated by Kormendy et al. (2009) is simpler and more appropriate, but we adhere to the historical nomenclature in this paper.
3.1.2. Nucleated and non-nucleated dwarfs
Figure 1 distinguishes between nucleated dwarfs, indicated as dEs(N), and non-nucleated dwarfs, which are hereafter simply referred to as dEs/dSphs. Nucleated dwarfs tend to have systematically higher masses and mean surface densities than non-nucleated ones. If we fit the mass–size relation of dEs/dSphs and dEs(N) separately, the former has a significantly steeper slope (0.26 ± 0.01) than the latter (0.20 ± 0.01). The posterior probability distributions of the fitting parameters (Fig. 3) confirm that the mass–size relations of these two populations are inconsistent with each other at more than 3σ. As suggested by Jerjen & Binggeli (1997), nucleated dEs(N) may form a different ‘breed’ than non-nucleated dEs, which are instead of the same ‘breed’ as dSphs and UDGs. In particular, dEs(N) generally have Sersic indexes (ns) higher than 1 (Binggeli & Cameron 1991), which progressively increase with stellar mass or luminosity, forming a single monotonic ns − M★ relation together with Es (Jerjen & Binggeli 1997).
The mass–size relation of UDGs naturally extends that of dEs/dSphs. This fact, which is evident by eye, is further confirmed by their roughly consistent best-fit slopes: 0.18 ± 0.06 for UDGs and 0.26 ± 0.01 for dEs/dSphs (see Table A.1). We notice that a few dEs/dSphs meet the selection criteria of UDGs (see the dashed grey lines in Fig. 1, van Dokkum et al. 2015). Some of them, indeed, are considered as UDGs in a few studies (e.g. Lim et al. 2020; Venhola et al. 2017). However, even if we remove these ambiguous galaxies, the best-fit slope of dEs/dSphs is still consistent with that of UDGs. This suggests that UDGs do not constitute a distinct population from passive (non-nucleated) dwarfs, as has already been pointed out by several authors (Conselice 2018; Chilingarian et al. 2019; Marleau et al. 2021; Zöller et al. 2024). Notably, current surveys seem to lack and/or under-represent more extreme dwarfs with log(Mbar/ M⊙)≃105 − 107, R50, bar > 1 kpc, and Σ50, bar < 1 M⊙ pc−2, given the lack of galaxies in this region of the parameter space, which is unavoidably affected by strong selection biases.
3.2. Star-forming galaxies
In Fig. 4 and Fig. 5, we add the disks of star-forming galaxies. In Paper I, we found that star-forming galaxies define two separate sequences: one formed by star-dominated HSD disks (mostly Sa-Sc) and one by gas-dominated LSD disks (mostly Sd-dI). In the following, we first discuss the possible links between HSD disks and Es/S0s, then those between LSD disks and dEs/dSphs. Note that we use the terminology ‘LSD disks’ because the dominant mass component of these galaxies (atomic gas) lies in a thin rotating disk, but their subdominant stellar component may potentially be a thicker disk and/or a more spheroidal structure.
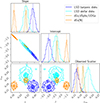 |
Fig. 3. Same as Fig. 2 but for non-nucleated dEs/dSphs and UDGs, nucleated dEs(N), baryonic LSD disks, and stellar LSD disks. |
3.2.1. Structural relations of high-mass galaxies
The HSD disks are star-dominated (Mgas/Mbar ≲ 0.3), so their positions in the structural planes do not vary substantially when stellar or baryonic quantities are taken into consideration. This is evident in Fig. 2, which shows that the mass–size relations of stellar and baryonic HSD disks are consistent with each other within less than 1σ. In the mass–size planes, HSD disks lie towards the left of the Es/bulge sequence, having systematically smaller masses and mean surface densities. Indeed, Fig. 2 shows that the mass–size relations of HSD disks and Es/bulges are statistically different at about 3σ. Clearly, HSD disks could ‘move’ towards the sequence of Es/bulges only through major mergers (e.g. Toomre 1977), increasing their baryonic mass and mean surface density, as well as altering their internal kinematic structure. We note, however, that the majority of Es probably formed and quenched in the early Universe (z ≃ 10) through very rapid processes (e.g. McGaugh et al. 2024), whereas HSD disks may form at a slower pace (e.g. Schombert et al. 2019), so the two types of galaxies may simply form and evolve through different channels.
The HSD disks largely overlap with S0 disks, indicating that the former may naturally evolve into the latter as they run out of gas. Indeed, Fig. 2 shows that the mass–size relations of S0 disks and HSD baryonic disks are consistent with each other within about 2σ. The agreement becomes even more significant (about 1σ) when we consider the HSD stellar disks, neglecting the gas component. This result is in agreement with previous photometric studies (e.g. Kormendy & Bender 2012) and dynamical ones (Rizzo et al. 2018; Shelest & Lelli 2020). It also supports the classification scheme proposed by van den Bergh (1976), in which S0s and spirals form two parallel sequences.
3.2.2. Structural relations of low-mass galaxies
The LSD disks are gas-dominated (Mgas/Mbar ≃ 0.3 − 1.0), so their positions in the structural planes can substantially vary when considering stellar or baryonic quantities. In the baryonic planes (Fig. 4), LSD disks lie to the right of the dEs/dSphs/UDGs sequence, having slightly higher masses and mean surface densities. In the stellar mass–size plane (Fig. 5), instead, there is a clear overlap between LSD galaxies and dEs/dSphs/UDGs in the mass range M★ ≃ 107 − 109 M⊙. This is confirmed by Fig. 3, which shows that the mass–size relation of dEs/dSphs/UDGs is different from that of baryonic LSD disks at about 3σ, but virtually identical to that of stellar LSD disks. Notably, several LSD galaxies in the SPARC sample may be classified as ‘gas-rich UDGs’ but they are actually ‘classical’ Sd-to-dI galaxies, indicating again that the UDG definition is arbitrary.
One may wonder whether our results are affected by projection effects because dEs/dSphs/UDGs in galaxy clusters are possibly thicker than star-forming dwarfs (e.g. Chen et al. 2023; Sánchez-Janssen et al. 2019; Rong et al. 2020). However, we find that dEs/dSphs/UDGs with different apparent axis ratios follow the same relation with merely small differences in their observed scatter, eliminating the possibility of projection effects.
Gas-dominated LSD galaxies with M★ ≃ 105 − 107 M⊙ are not well represented in the SPARC sample but are known to exist (see e.g. Fig. 1 in Lelli 2022), so it is likely that the overlap between LSD galaxies and dEs/dSphs/UDGs persists at lower masses. This is in line with the known fact that the stellar component of star-forming dwarfs is similar to that of passive dwarfs (e.g. Binggeli 1994; Ferguson & Binggeli 1994).
At the other end of the mass spectrum, LSD disks with M★ ≃ 1010 M⊙ do not have a clear ‘passive counterpart’ with similar structural properties. These massive LSD galaxies are known to live in low-density environments (e.g. Bothun et al. 1993, 1997), so they may just remain star-forming galaxies across the whole Hubble time. These massive LSD galaxies should not be confused with the so-called ‘giant low-surface-brightness’ (GLSB) galaxies, whose prototype is Malin 1 (Bothun et al. 1987). The GLSB galaxies are rare systems with a double structure: an inner high-surface-brightness component (such as a star-dominated HSD disk and/or a stellar bulge) and an outer extreme LSD disk (Lelli et al. 2010; Hagen et al. 2016; Saburova et al. 2019, 2021). The GLSB galaxies are not included in our sample.
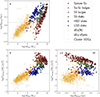 |
Fig. 4. Same as Fig. 1 but adding star-forming disks from the SPARC database. As we show in Paper I, star-forming disks define two distinct sequences: one formed by star-dominated HSD galaxies (mostly Sa-Sc) and one by gas-dominated LSD galaxies (mostly Sd-dI). |
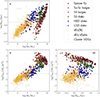 |
Fig. 5. Same as Fig. 4 but considering stellar quantities rather than baryonic ones. The main difference occurs for gas-dominated LSD disks, which move closer to the sequence defined by passive dwarfs (dEs, dSphs, and UDGs). |
4. Discussion
In the previous section, we present the structural planes between Mbar, R50, bar, and Σ50, bar for both passive and star-forming galaxies, spanning over ∼8 orders of magnitude in mass. For star-forming HSD galaxies (Sa-Sc) and passive galaxies (Es, S0s, dEs/dSphs, and UDGs), the baryonic and stellar planes are nearly the same because these objects are star-dominated. Indeed, we confirm a series of known results: (1) HSD disks overlap with S0 disks, so spiral galaxies may simply transform into lenticulars as they run out of gas; (2) there is a dichotomy between Es/bulges and dEs/dSphs; and (3) UDGs are an extension of the sequence of typical dEs/dSphs. Notably, extreme dwarf galaxies with Mbar ≃ 105 − 107 M⊙, R50, bar > 1 kpc, and Σbar, 50 < 1 M⊙ pc−2 may be under-represented in current samples, given the potential selection effects in luminosity and surface brightness in this region of the parameter space.
For star-forming LSD galaxies (mostly Sd-dI), the structural relations change significantly if one considers baryonic or stellar quantities because these galaxies are gas-dominated. Star-forming LSD galaxies are offset from passive dwarfs in the baryonic planes, but the two populations overlap when the stellar planes are taken into account, especially for M★ ≲ 109 M⊙. The obvious interpretation is that passive dwarfs arise from star-forming dwarfs that have lost their gas component, moving across the baryonic planes but staying almost in the same position of the stellar planes. Importantly, differently from the possible evolution between spirals and lenticulars, the evolution from dIs to dEs/dSphs cannot be just a matter of converting gas into stars, because the baryonic mass would be conserved. The cold gas needs to be physically removed from the galaxy, so the key question is what physical processes (internal or external) may be responsible for such gas removal.
Star-forming dwarfs consume their gas in a very inefficient way and have gas depletion times much longer than the Hubble time (van Zee 2001; McGaugh et al. 2017). In addition, there is overwhelming evidence that stellar feedback (stellar winds and supernovae) is unable to eject substantial amounts of gas out of the potential wells of dwarf galaxies (Lelli et al. 2014a,b; Concas et al. 2017, 2019, 2022; McQuinn et al. 2019; Marasco et al. 2023), so feedback-driven quenching is not a viable possibility. Star-forming dwarfs evolving in isolation will probably remain on the LSD sequence of the structural planes for most of their lifetime. The only way to remove the dominant gas component of star-forming dwarfs is via some external mechanisms due to the environment. For example, there is mounting evidence of gas stripping in galaxy clusters due to a variety of different mechanisms, such as ram-pressure stripping, tidal stripping, and galaxy harassment (e.g. Boselli & Gavazzi 2014; Boselli et al. 2022). Similar mechanisms may also be effective in galaxy groups in proximity of the central galaxy, as is suggested by the strong morphology-density relation of dwarf galaxies in the Local Group (e.g. Mateo 1998; Tolstoy et al. 2009).
A long-standing issue with the possible evolution from dIs to dEs/dSphs is that the overlap in the stellar planes mostly occurs in the mass range where dEs/dSphs are nucleated, whereas dIs rarely show nuclei (Côté et al. 2006; Lisker et al. 2007). The simplest possibility is that star-forming dwarfs evolve into non-nucleated dwarfs, while nucleated dwarfs form a different category of galaxies (e.g. Jerjen & Binggeli 1997). Another possibility is that some star-forming dwarfs experience a starburst before losing their gas, creating a central nuclei and evolving into dEs(N) (Lelli et al. 2014a). The latter scenario is in agreement with the fact that the mass distribution (gas, stars, and dark matter) of starburst dwarfs is more concentrated than that of typical dIs (van Zee et al. 2001; Lelli et al. 2012a,b), but adheres to that of the brightest dEs (Lelli et al. 2014a; Ryś et al. 2014).
5. Summary
We studied the structural relations between Mbar, R50, bar, and Σ50, bar for both passive and star-forming galaxies. The difference between baryonic and stellar structural relations is virtually negligible for star-dominated HSD galaxies (mostly Sa-Sc) and passive galaxies (Es, S0s, dEs/dSphs, and UDGs), but it is very significant for gas-dominated LSD galaxies (mostly Sd-dI). Our results can be summarised as follows:
-
Passive stellar components form four distinct sequences, or ‘families’, namely, (i) Es and bulges, (ii) S0 disks, (iii) non-nucleated dwarfs (dEs/dSphs/UDGs), and (iv) nucleated dEs.
-
Star-forming HSD disks overlap with S0 disks in both the baryonic and stellar planes, so spirals may simply turn into lenticulars as they convert all their available gas into stars.
-
Star-forming LSD disks form a sequence that is offset from that of dEs/dSphs/UDGs towards higher Mbar and Σ50, bar, but the two galaxy populations overlap in the stellar planes, suggesting that star-forming dwarfs could evolve into passive dwarfs after gas removal due to some external mechanism.
-
The UDGs seem to be an extension of the sequence of non-nucleated dEs/dSphs; their progenitors may be typical star-forming LSD disks that lost their gas, with no need for a major expansion of their stellar component.
In the coming years, the combination of wide-field H I surveys from Square Kilometre Array (SKA) pathfinders (e.g. WALLABY, Murugeshan et al. 2024) with near-infrared photometric surveys will allow us to study the baryonic structural relations of galaxies for much larger galaxy samples and in a variety of different cosmic environments. A first step in this direction is represented by the upcoming BIG-SPARC database (Haubner et al. 2024), which will provide H I and near-infrared data for several thousands of galaxies.
Acknowledgments
The authors thank Konstantin Haubner and Illaria Ruffa for constructive discussions during this study. EDT was supported by the European Research Council (ERC) under grant agreement no. 101040751.
References
- Bartlett, D. J., & Desmond, H. 2023, ArXiv e-prints [arXiv:2309.00948] [Google Scholar]
- Binggeli, B. 1994, Eur. South. Obs. Conf. Workshop Proc., 49, 13 [Google Scholar]
- Binggeli, B., & Cameron, L. M. 1991, A&A, 252, 27 [NASA ADS] [Google Scholar]
- Boselli, A., & Gavazzi, G. 2014, A&ARv, 22, 74 [Google Scholar]
- Boselli, A., Fossati, M., & Sun, M. 2022, A&ARv, 30, 3 [NASA ADS] [CrossRef] [Google Scholar]
- Bothun, G. D., Impey, C. D., Malin, D. F., & Mould, J. R. 1987, AJ, 94, 23 [NASA ADS] [CrossRef] [Google Scholar]
- Bothun, G. D., Schombert, J. M., Impey, C. D., Sprayberry, D., & McGaugh, S. S. 1993, AJ, 106, 530 [NASA ADS] [CrossRef] [Google Scholar]
- Bothun, G., Impey, C., & McGaugh, S. 1997, PASP, 109, 745 [NASA ADS] [CrossRef] [Google Scholar]
- Bruzual, G., & Charlot, S. 2003, MNRAS, 344, 1000 [NASA ADS] [CrossRef] [Google Scholar]
- Chabrier, G. 2003, ApJ, 586, L133 [NASA ADS] [CrossRef] [Google Scholar]
- Chen, L., Zhang, H.-X., Lin, Z., et al. 2023, ApJ, 958, 117 [Google Scholar]
- Chilingarian, I. V., Afanasiev, A. V., Grishin, K. A., Fabricant, D., & Moran, S. 2019, ApJ, 884, 79 [NASA ADS] [CrossRef] [Google Scholar]
- Concas, A., Popesso, P., Brusa, M., et al. 2017, A&A, 606, A36 [NASA ADS] [CrossRef] [EDP Sciences] [Google Scholar]
- Concas, A., Popesso, P., Brusa, M., Mainieri, V., & Thomas, D. 2019, A&A, 622, A188 [NASA ADS] [CrossRef] [EDP Sciences] [Google Scholar]
- Concas, A., Maiolino, R., Curti, M., et al. 2022, MNRAS, 513, 2535 [NASA ADS] [CrossRef] [Google Scholar]
- Conselice, C. J. 2018, Res. Notes Am. Astron. Soc., 2, 43 [Google Scholar]
- Côté, P., Piatek, S., Ferrarese, L., et al. 2006, ApJS, 165, 57 [Google Scholar]
- Eigenthaler, P., Puzia, T. H., Taylor, M. A., et al. 2018, ApJ, 855, 142 [Google Scholar]
- Ferguson, H. C., & Binggeli, B. 1994, A&ARv, 6, 67 [NASA ADS] [CrossRef] [Google Scholar]
- Ferrarese, L., Côté, P., MacArthur, L. A., et al. 2020, ApJ, 890, 128 [Google Scholar]
- Gannon, J. S., Ferré-Mateu, A., Forbes, D. A., et al. 2024, MNRAS, 531, 1856 [NASA ADS] [CrossRef] [Google Scholar]
- Gavazzi, G., Donati, A., Cucciati, O., et al. 2005, A&A, 430, 411 [NASA ADS] [CrossRef] [EDP Sciences] [Google Scholar]
- Graham, A. W., & Guzmán, R. 2003, AJ, 125, 2936 [Google Scholar]
- Hagen, L. M. Z., Seibert, M., Hagen, A., et al. 2016, ApJ, 826, 210 [NASA ADS] [CrossRef] [Google Scholar]
- Haubner, K., Lelli, F., Di Teodoro, E., et al. 2024, ArXiv e-prints [arXiv:2411.13329] [Google Scholar]
- Hua, Z., Lelli, F., Di Teodoro, E., McGaugh, S., & Schombert, J. 2025, A&A, 703, A223 [NASA ADS] [CrossRef] [EDP Sciences] [Google Scholar]
- Iodice, E., Cantiello, M., Hilker, M., et al. 2020, A&A, 642, A48 [EDP Sciences] [Google Scholar]
- Jerjen, H., & Binggeli, B. 1997, ASP Conf. Ser., 116, 239 [Google Scholar]
- Kormendy, J. 1985, ApJ, 295, 73 [NASA ADS] [CrossRef] [Google Scholar]
- Kormendy, J., & Bender, R. 2012, ApJS, 198, 2 [Google Scholar]
- Kormendy, J., Fisher, D. B., Cornell, M. E., & Bender, R. 2009, ApJS, 182, 216 [Google Scholar]
- Lelli, F. 2022, Nat. Astron., 6, 35 [NASA ADS] [CrossRef] [Google Scholar]
- Lelli, F. 2024, A&A, 689, L3 [NASA ADS] [CrossRef] [EDP Sciences] [Google Scholar]
- Lelli, F., Fraternali, F., & Sancisi, R. 2010, A&A, 516, A11 [NASA ADS] [CrossRef] [EDP Sciences] [Google Scholar]
- Lelli, F., Verheijen, M., Fraternali, F., & Sancisi, R. 2012a, A&A, 537, A72 [NASA ADS] [CrossRef] [EDP Sciences] [Google Scholar]
- Lelli, F., Verheijen, M., Fraternali, F., & Sancisi, R. 2012b, A&A, 544, A145 [NASA ADS] [CrossRef] [EDP Sciences] [Google Scholar]
- Lelli, F., Fraternali, F., & Verheijen, M. 2014a, A&A, 563, A27 [NASA ADS] [CrossRef] [EDP Sciences] [Google Scholar]
- Lelli, F., Verheijen, M., & Fraternali, F. 2014b, A&A, 566, A71 [NASA ADS] [CrossRef] [EDP Sciences] [Google Scholar]
- Lelli, F., McGaugh, S. S., & Schombert, J. M. 2016, AJ, 152, 157 [Google Scholar]
- Lelli, F., McGaugh, S. S., Schombert, J. M., & Pawlowski, M. S. 2017, ApJ, 836, 152 [Google Scholar]
- Li, J., Greene, J. E., Greco, J. P., et al. 2023, ApJ, 955, 1 [NASA ADS] [CrossRef] [Google Scholar]
- Lim, S., Côté, P., Peng, E. W., et al. 2020, ApJ, 899, 69 [CrossRef] [Google Scholar]
- Lisker, T., Grebel, E. K., Binggeli, B., & Glatt, K. 2007, ApJ, 660, 1186 [Google Scholar]
- Marasco, A., Belfiore, F., Cresci, G., et al. 2023, A&A, 670, A92 [NASA ADS] [CrossRef] [EDP Sciences] [Google Scholar]
- Marleau, F. R., Habas, R., Poulain, M., et al. 2021, A&A, 654, A105 [NASA ADS] [CrossRef] [EDP Sciences] [Google Scholar]
- Mateo, M. L. 1998, ARA&A, 36, 435 [NASA ADS] [CrossRef] [Google Scholar]
- McGaugh, S. S., & Schombert, J. M. 2014, AJ, 148, 77 [Google Scholar]
- McGaugh, S. S., Schombert, J. M., & Lelli, F. 2017, ApJ, 851, 22 [Google Scholar]
- McGaugh, S. S., Schombert, J. M., Lelli, F., & Franck, J. 2024, ApJ, 976, 13 [NASA ADS] [CrossRef] [Google Scholar]
- McQuinn, K. B. W., van Zee, L., & Skillman, E. D. 2019, ApJ, 886, 74 [NASA ADS] [CrossRef] [Google Scholar]
- Murugeshan, C., Deg, N., Westmeier, T., et al. 2024, PASA, 41, e088 [Google Scholar]
- Ordenes-Briceño, Y., Eigenthaler, P., Taylor, M. A., et al. 2018, ApJ, 859, 52 [Google Scholar]
- Prantzos, N. 2009, IAU Symp., 254, 381 [Google Scholar]
- Rizzo, F., Fraternali, F., & Iorio, G. 2018, MNRAS, 476, 2137 [Google Scholar]
- Rong, Y., Guo, Q., Gao, L., et al. 2017, MNRAS, 470, 4231 [Google Scholar]
- Rong, Y., Dong, X.-Y., Puzia, T. H., et al. 2020, ApJ, 899, 78 [NASA ADS] [CrossRef] [Google Scholar]
- Rong, Y., Hu, H., He, M., et al. 2024, ArXiv e-prints [arXiv:2404.00555] [Google Scholar]
- Ryś, A., van de Ven, G., & Falcón-Barroso, J. 2014, MNRAS, 439, 284 [CrossRef] [Google Scholar]
- Saburova, A. S., Chilingarian, I. V., Kasparova, A. V., et al. 2019, MNRAS, 489, 4669 [Google Scholar]
- Saburova, A. S., Chilingarian, I. V., Kasparova, A. V., et al. 2021, MNRAS, 503, 830 [NASA ADS] [CrossRef] [Google Scholar]
- Sánchez-Janssen, R., Puzia, T. H., Ferrarese, L., et al. 2019, MNRAS, 486, L1 [CrossRef] [Google Scholar]
- Schombert, J. M. 2006, AJ, 131, 296 [Google Scholar]
- Schombert, J. M. 2016, AJ, 152, 214 [CrossRef] [Google Scholar]
- Schombert, J., & McGaugh, S. 2014, PASA, 31, e036 [Google Scholar]
- Schombert, J., McGaugh, S., & Lelli, F. 2019, MNRAS, 483, 1496 [NASA ADS] [Google Scholar]
- Schombert, J., McGaugh, S., & Lelli, F. 2022, AJ, 163, 154 [NASA ADS] [CrossRef] [Google Scholar]
- Serra, P., Oosterloo, T., Morganti, R., et al. 2012, MNRAS, 422, 1835 [Google Scholar]
- Shelest, A., & Lelli, F. 2020, A&A, 641, A31 [EDP Sciences] [Google Scholar]
- Taylor, E. N., Hopkins, A. M., Baldry, I. K., et al. 2011, MNRAS, 418, 1587 [Google Scholar]
- Tolstoy, E., Hill, V., & Tosi, M. 2009, ARA&A, 47, 371 [Google Scholar]
- Toomre, A. 1977, in Evolution of Galaxies and Stellar Populations, eds. B. M. Tinsley, R. B. G. Larson, & D. Campbell, 401 [Google Scholar]
- van den Bergh, S. 1976, ApJ, 206, 883 [NASA ADS] [CrossRef] [Google Scholar]
- van Dokkum, P. G., Abraham, R., Merritt, A., et al. 2015, ApJ, 798, L45 [NASA ADS] [CrossRef] [Google Scholar]
- van Zee, L. 2001, AJ, 121, 2003 [NASA ADS] [CrossRef] [Google Scholar]
- van Zee, L., Salzer, J. J., & Skillman, E. D. 2001, AJ, 122, 121 [Google Scholar]
- Venhola, A., Peletier, R., Laurikainen, E., et al. 2017, A&A, 608, A142 [NASA ADS] [CrossRef] [EDP Sciences] [Google Scholar]
- Wright, A. C., Tremmel, M., Brooks, A. M., et al. 2021, MNRAS, 502, 5370 [NASA ADS] [CrossRef] [Google Scholar]
- Zöller, R., Kluge, M., Staiger, B., & Bender, R. 2024, ApJS, 271, 52 [CrossRef] [Google Scholar]
Appendix A: The best-fit parameters
We fitted the scaling relations of different galaxy populations adopting a power-law relation,
 (A.1)
(A.1)
where x and y represent M★, R50, ★, or Σ50, ★, respectively. Following Paper I, we determined the best-fit α and β using ROXY (Bartlett & Desmond 2023). The results of different galaxy populations are shown in Table A.1. We exhibit the best-fit lines of the main galaxy populations in Figs. A.1 and A.2. Given that we compiled structural parameters from several different studies, the errors on these quantities may not be entirely self-consistent. Thus, we prefer to perform the linear fits without considering the errors on the structural parameters. This choice implies that the intrinsic scatter provided by the ROXY software is basically the same as the observed scatter (σobs), as shown in Table A.1.
ROXY best-fit parameters of the structural relations of different galaxy populations.
 |
Fig. A.1. Same as Fig. 4 but adding the best-fit lines to the scaling relations of Es, bulges, S0 disks, HSD baryonic disks, LSD baryonic disks, dEs/dSphs/UDGs, and dEs(N), respectively. The best-fit line of each group is matched with the same colour. |
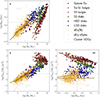 |
Fig. A.2. Same as Fig. 5 but adding the best-fit lines to the scaling relations of Es, bulges, S0 disks, HSD stellar disks, LSD stellar disks, dEs/dSphs/UDGs, and dEs(N), respectively. The best-fit line of each group is matched with the same colour. |
All Tables
ROXY best-fit parameters of the structural relations of different galaxy populations.
All Figures
|
Fig. 1. Baryonic structural relations for passive galaxies: Mbar vs. R50, bar (top left), Mbar vs. Σ50, bar (bottom left), and R50, bar vs. Σbar vs. (bottom right). See Sect. 2 for references to the various datasets of Es, S0s, dEs/dSphs, and UDGs. We also considered the ‘classical’ bulges of Sa-Sc galaxies. The mean uncertainties of our sample galaxies are indicated in the top corner of each panel. For all these objects, the baryonic structural relations are virtually the same as the stellar ones. The dashed grey lines show the selection criteria of UDGs from van Dokkum et al. (2015). |
| In the text | |
|
Fig. 2. Corner plots of the mass–size relations of Es and bulges, S0 disks, HSD baryonic disks, and HSD stellar disks. The panels show the 2D posterior probability distributions of pairs of fitting parameters, and the 1D marginalised probability distribution of each fitting parameter (histograms). In the 2D distributions, the contours correspond to the 1σ, 2σ, and 3σ regions, respectively. In the histograms, the dashed lines correspond to the median values. |
| In the text | |
|
Fig. 3. Same as Fig. 2 but for non-nucleated dEs/dSphs and UDGs, nucleated dEs(N), baryonic LSD disks, and stellar LSD disks. |
| In the text | |
|
Fig. 4. Same as Fig. 1 but adding star-forming disks from the SPARC database. As we show in Paper I, star-forming disks define two distinct sequences: one formed by star-dominated HSD galaxies (mostly Sa-Sc) and one by gas-dominated LSD galaxies (mostly Sd-dI). |
| In the text | |
|
Fig. 5. Same as Fig. 4 but considering stellar quantities rather than baryonic ones. The main difference occurs for gas-dominated LSD disks, which move closer to the sequence defined by passive dwarfs (dEs, dSphs, and UDGs). |
| In the text | |
|
Fig. A.1. Same as Fig. 4 but adding the best-fit lines to the scaling relations of Es, bulges, S0 disks, HSD baryonic disks, LSD baryonic disks, dEs/dSphs/UDGs, and dEs(N), respectively. The best-fit line of each group is matched with the same colour. |
| In the text | |
|
Fig. A.2. Same as Fig. 5 but adding the best-fit lines to the scaling relations of Es, bulges, S0 disks, HSD stellar disks, LSD stellar disks, dEs/dSphs/UDGs, and dEs(N), respectively. The best-fit line of each group is matched with the same colour. |
| In the text | |
Current usage metrics show cumulative count of Article Views (full-text article views including HTML views, PDF and ePub downloads, according to the available data) and Abstracts Views on Vision4Press platform.
Data correspond to usage on the plateform after 2015. The current usage metrics is available 48-96 hours after online publication and is updated daily on week days.
Initial download of the metrics may take a while.