Fig. 1.
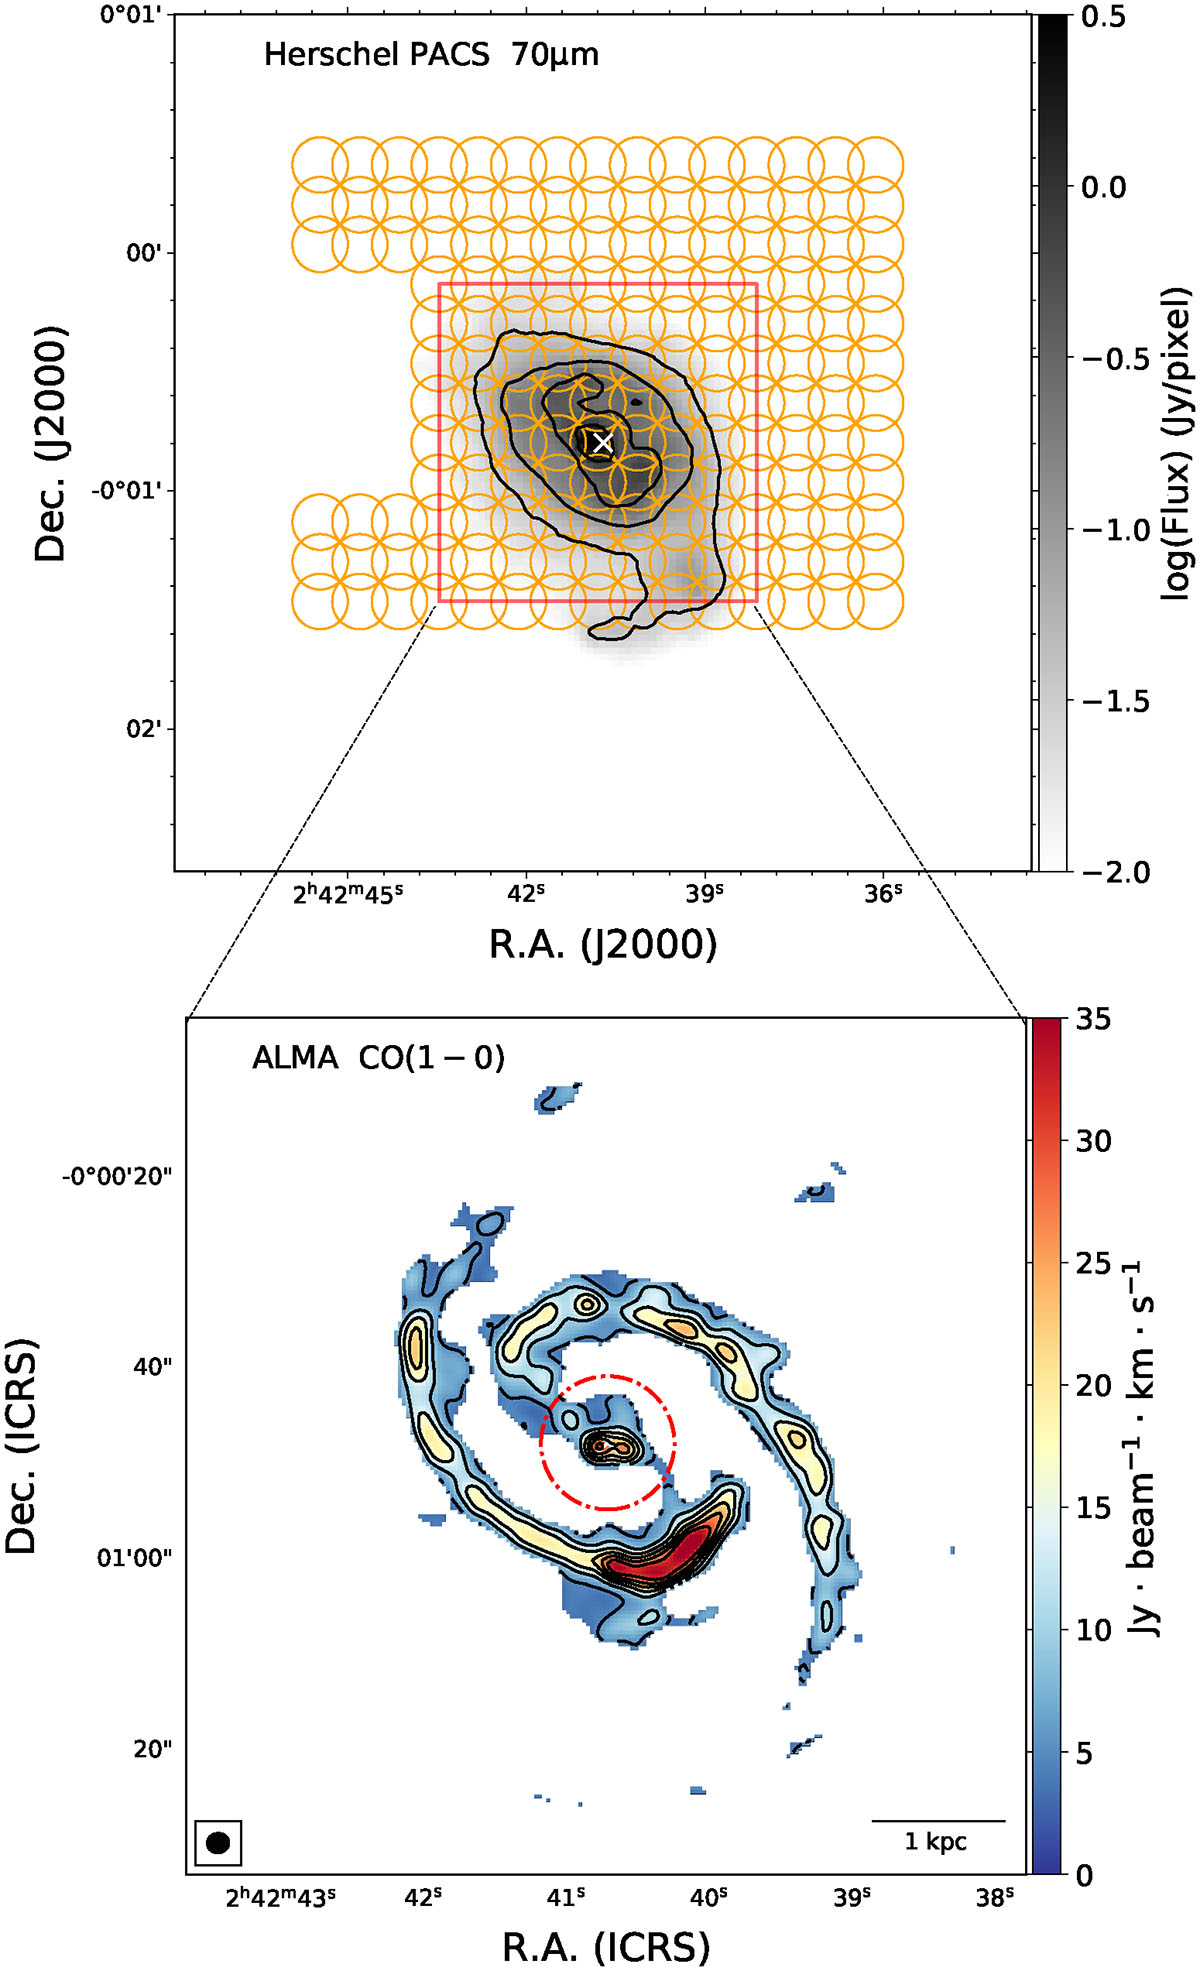
Download original image
Upper panel: JCMT observing positions of NGC 1068 overlaid on a Herschel/PACS 70 μm grayscale map. The black contours indicate the 70 μm continuum, starting from 100σ and increasing in steps of 3σ, where 1σ = 3 × 10⁻⁴ Jy/pixel. The white cross denotes the position of the central AGN in the galaxy. Orange circles indicate the positions observed in jiggle mapping mode. The red square shows the area (1.5′ × 1.5′) studied in this work. Bottom panel: Zoomed-in view of the central region obtained from the ALMA high-resolution CO (1–0) map (project ID: 2018.1.01684.S, Saito et al. 2022b; see also Nakajima et al. 2023). Black contours represent CO (1–0) integrated intensity levels, ranging from 4σ to 20σ in steps of 4σ, where 1σ = 0.25 Jy beam−1 km s−1. The dotted-dashed red circle represents the JCMT beam size of 14″ (approximately 1.1 kpc).
Current usage metrics show cumulative count of Article Views (full-text article views including HTML views, PDF and ePub downloads, according to the available data) and Abstracts Views on Vision4Press platform.
Data correspond to usage on the plateform after 2015. The current usage metrics is available 48-96 hours after online publication and is updated daily on week days.
Initial download of the metrics may take a while.