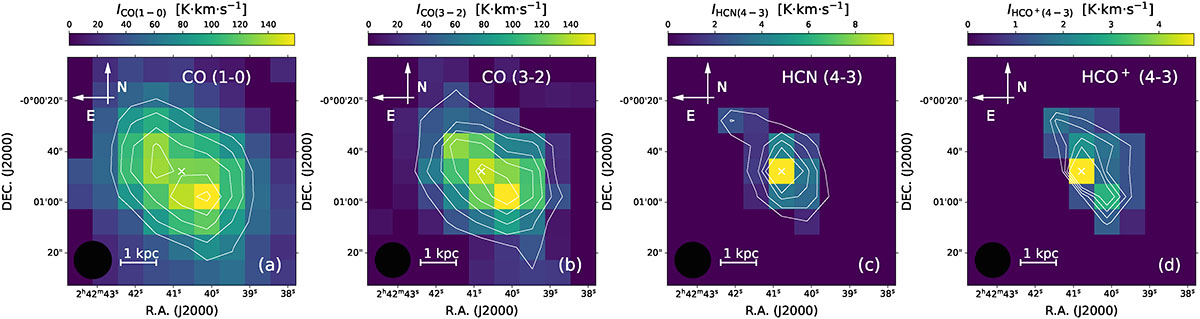
Fig. 2.
Download original image
Integrated intensity (moment 0) maps of molecular gas tracers, shown with a pixel size of 10″. (a): CO (1 − 0) map with contours at levels of 15–35σ in steps of 5σ (σ = 4.34 K km s−1). (b): CO (3 − 2) map with contours from 13 to 57σ in steps of 11σ (σ = 2.39 K km s−1). (c): HCN (4 − 3) map with contours from 3 to 12σ in steps of 3σ (σ = 0.38 K km s−1). (d): HCO+ (4 − 3) map with contours from 3 to 6σ in steps of 1σ (σ = 0.41 K km s−1). The white cross marks the location of the AGN in NGC 1068. Pixels with S/Ns below 3 are masked. The beam size and scale bar are shown in the lower-left corner of each panel.
Current usage metrics show cumulative count of Article Views (full-text article views including HTML views, PDF and ePub downloads, according to the available data) and Abstracts Views on Vision4Press platform.
Data correspond to usage on the plateform after 2015. The current usage metrics is available 48-96 hours after online publication and is updated daily on week days.
Initial download of the metrics may take a while.