Fig. 3.
Download original image
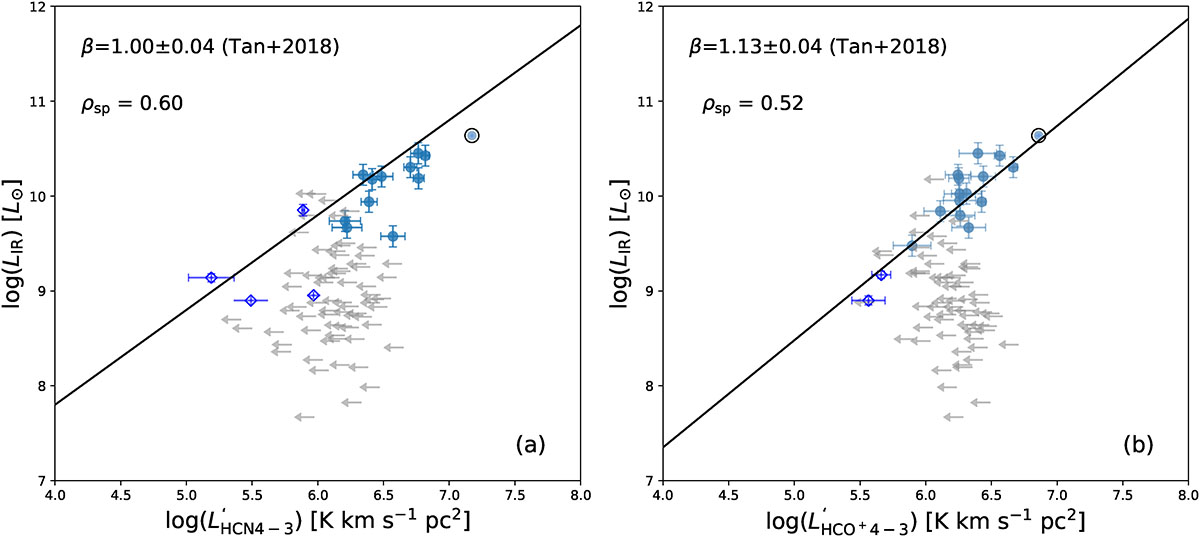
Relations between IR luminosities and dense molecular line luminosities in logarithmic scale. (a): LIR − L′HCN(4 − 3). (b): LIR − L′HCO+(4 − 3). Detected data are shown as solid points, data points obtained from stacked spectra are shown as diamonds, and upper limits are marked by gray leftward arrows. The black circles highlight the central region of NGC 1068, which hosts the AGN. The Spearman rank correlation coefficients (ρsp) are displayed in each panel. The solid lines and their slopes (β) represent the best-fit results from Bayesian regression, as adopted from Tan et al. (2018).
Current usage metrics show cumulative count of Article Views (full-text article views including HTML views, PDF and ePub downloads, according to the available data) and Abstracts Views on Vision4Press platform.
Data correspond to usage on the plateform after 2015. The current usage metrics is available 48-96 hours after online publication and is updated daily on week days.
Initial download of the metrics may take a while.