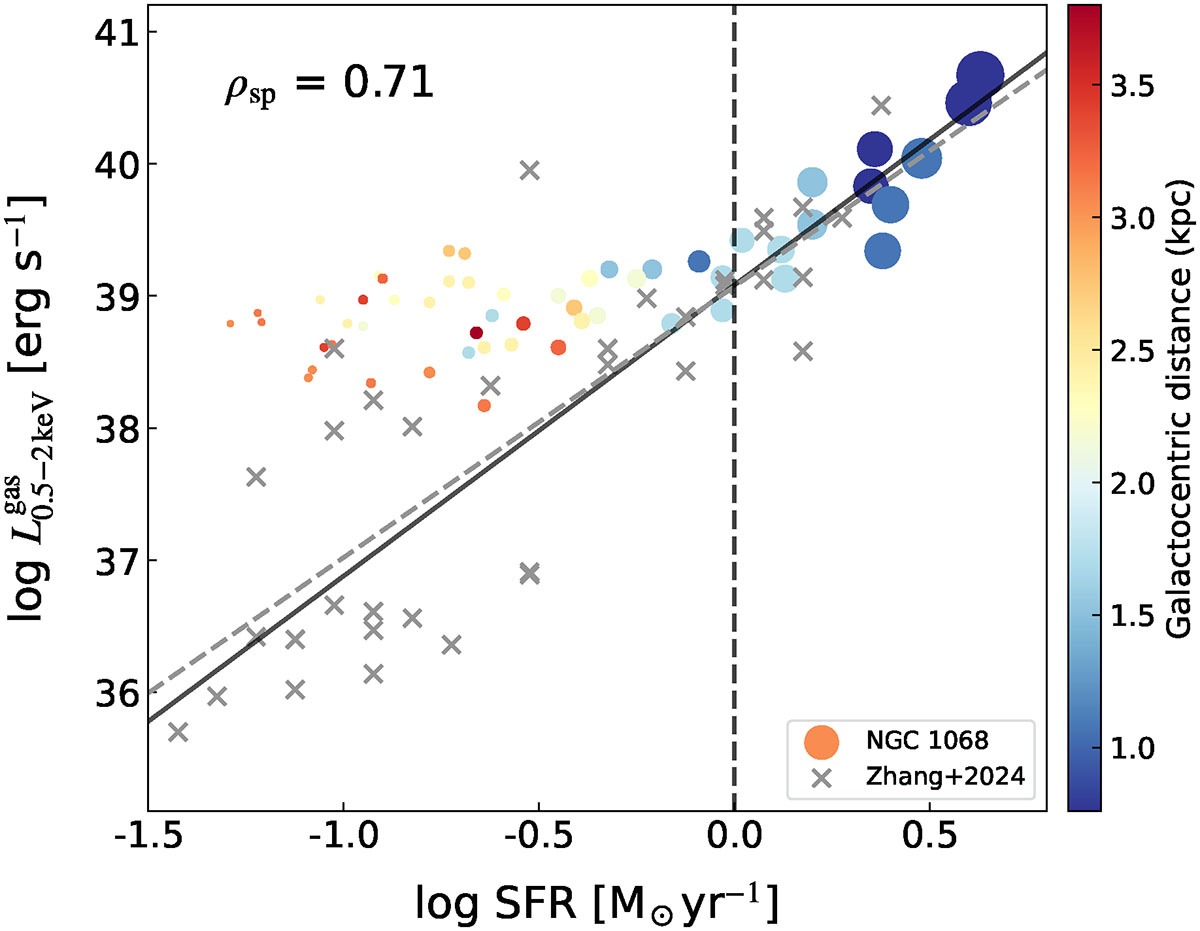
Fig. 4.
Download original image
Relation between SFR and thermal X-ray luminosity of hot gas on sub-kiloparsec scales. The color scale represents the distance from the galactic center, and the marker size represents the SFR surface density. The central data point containing the AGN has been excluded. The vertical dashed black line marks SFR = 1 M⊙ yr−1, corresponding to ΣSFR = 8.2 × 10⁻⁶ M⊙ yr−1 kpc−2. The solid black line represents the best-fit scaling relation as expressed in Eq. (5), derived from the central 12 data points with SFRs > 1 M⊙ yr−1. The Spearman rank correlation coefficient (ρsp) is provided. The gray crosses represent data from the central regions of nearby galaxies (Zhang et al. 2024), while the dashed gray line indicates the corresponding best-fit relation for these galaxies.
Current usage metrics show cumulative count of Article Views (full-text article views including HTML views, PDF and ePub downloads, according to the available data) and Abstracts Views on Vision4Press platform.
Data correspond to usage on the plateform after 2015. The current usage metrics is available 48-96 hours after online publication and is updated daily on week days.
Initial download of the metrics may take a while.