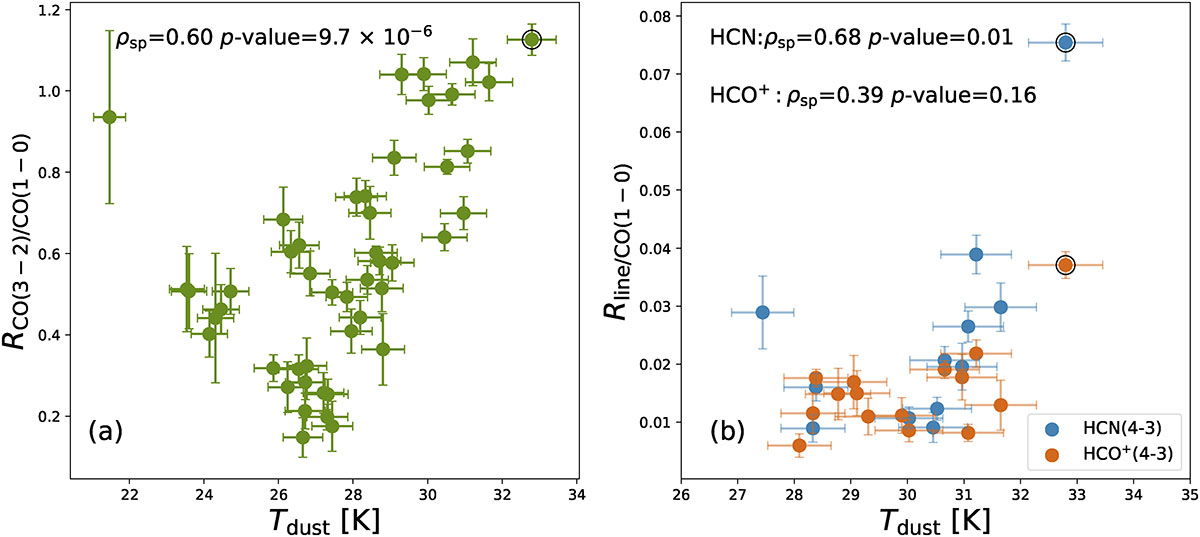
Fig. 5.
Download original image
(a): Correlation between dust temperature and gas excitation (traced by R31). (b): Correlation between dust temperature and dense and warm gas fraction, denoted by HCN (4 − 3)/CO (1 − 0) and HCO+ (4 − 3)/CO (1 − 0) integrated intensity ratios. Black circles denote the central position of NGC 1068, which hosts the AGN. The Spearman rank correlation coefficients are shown at each panel.
Current usage metrics show cumulative count of Article Views (full-text article views including HTML views, PDF and ePub downloads, according to the available data) and Abstracts Views on Vision4Press platform.
Data correspond to usage on the plateform after 2015. The current usage metrics is available 48-96 hours after online publication and is updated daily on week days.
Initial download of the metrics may take a while.