Fig. 6.
Download original image
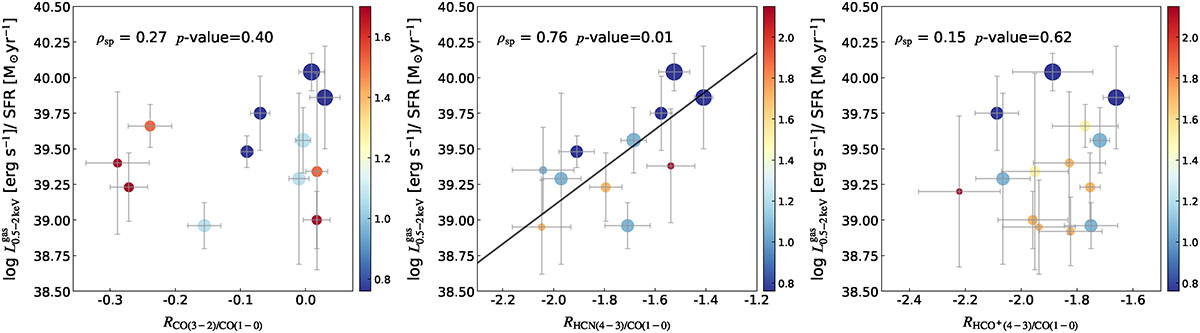
Relations between line ratios and ![]() /SFR on sub-kiloparsec scales. The color scale represents the distance from the galactic center in kiloparsecs, and the marker size represents the SFR surface density. The solid line in the central panel indicates the best-fit scaling relation. The Spearman rank correlation coefficient (ρsp) and p-value are given in each panel.
/SFR on sub-kiloparsec scales. The color scale represents the distance from the galactic center in kiloparsecs, and the marker size represents the SFR surface density. The solid line in the central panel indicates the best-fit scaling relation. The Spearman rank correlation coefficient (ρsp) and p-value are given in each panel.
Current usage metrics show cumulative count of Article Views (full-text article views including HTML views, PDF and ePub downloads, according to the available data) and Abstracts Views on Vision4Press platform.
Data correspond to usage on the plateform after 2015. The current usage metrics is available 48-96 hours after online publication and is updated daily on week days.
Initial download of the metrics may take a while.