Open Access
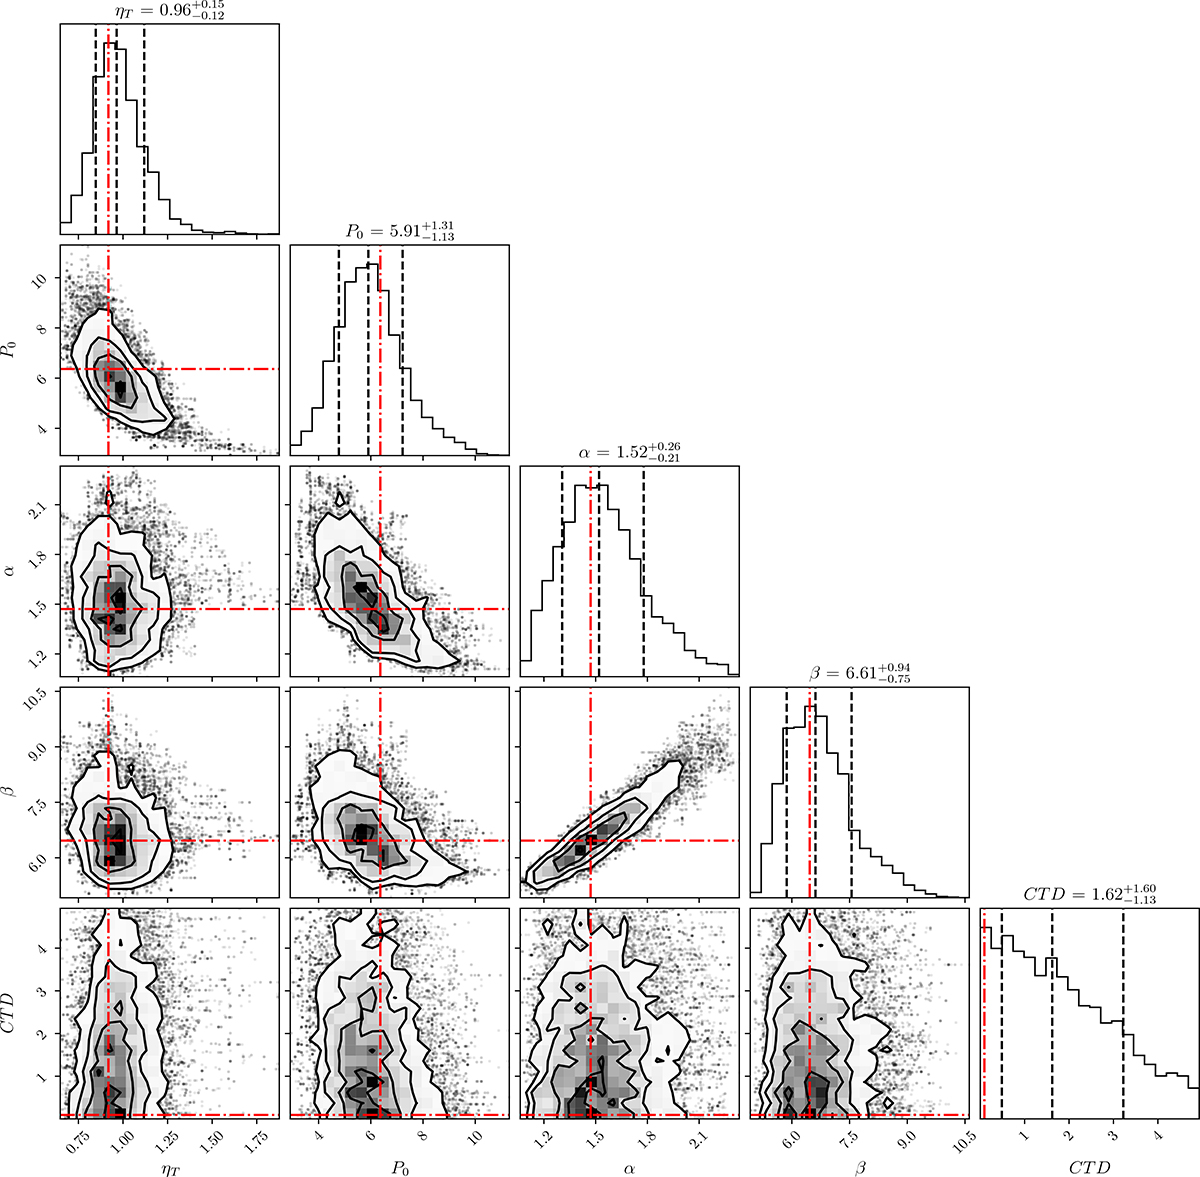
Fig. B.2.
Download original image
Posterior distributions of the pressure profile parameters for cluster PSZ2G325.70+17.34. Values in captions and dashed black lines report the median, 16th, and 84th percentiles (with plus minus intervals from the median values). Dash-dotted red lines show the position of the maximum likelihood value estimates.
Current usage metrics show cumulative count of Article Views (full-text article views including HTML views, PDF and ePub downloads, according to the available data) and Abstracts Views on Vision4Press platform.
Data correspond to usage on the plateform after 2015. The current usage metrics is available 48-96 hours after online publication and is updated daily on week days.
Initial download of the metrics may take a while.