Fig. 2.
Download original image
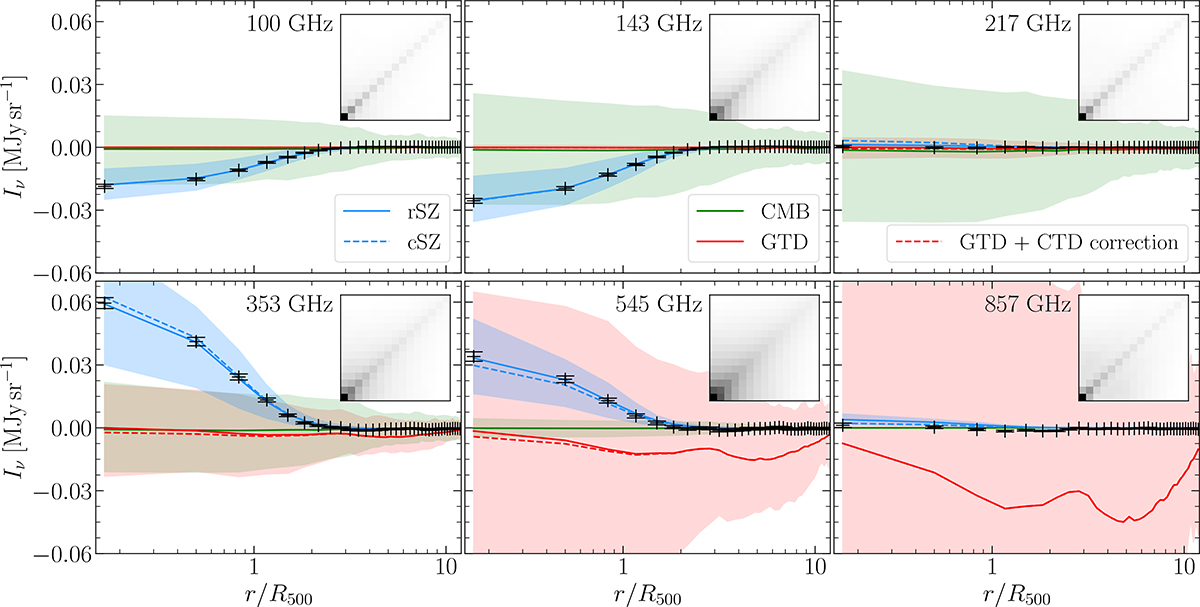
Stacked mean radial profiles in the Planck HFI channels towards 112 CHEX-MATE clusters. Black crosses with error bars show the observed mean SZ signal and its standard uncertainty. The CMB and GTD mean models are shown as solid green and red lines, respectively. The dash-dotted red line marks the dust component after the CTD correction. Solid and dashed blue lines represent the mean rSZ and cSZ models. Shaded areas cover the 16th–84th percentiles intervals. The normalised mean covariance matrices of the observed radial profiles (within 5R500), at each frequency, are shown as inserts.
Current usage metrics show cumulative count of Article Views (full-text article views including HTML views, PDF and ePub downloads, according to the available data) and Abstracts Views on Vision4Press platform.
Data correspond to usage on the plateform after 2015. The current usage metrics is available 48-96 hours after online publication and is updated daily on week days.
Initial download of the metrics may take a while.