Open Access
Fig. 3.
Download original image
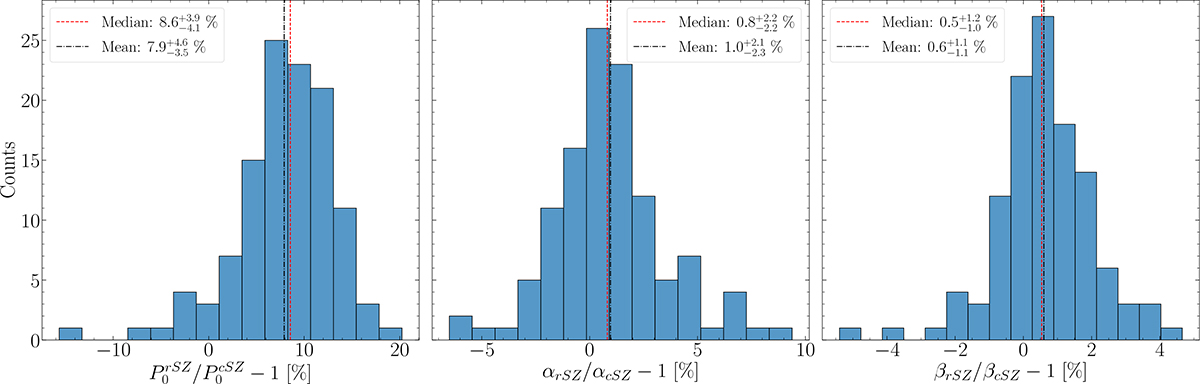
Fractional differences in the pressure profile parameters (from left to right: P0, α, β) between the rSZ and cSZ models. Median (dashed red) and mean (dash-dotted black) are shown with vertical lines and in the legends with 16th–84th percentiles from the reference values.
Current usage metrics show cumulative count of Article Views (full-text article views including HTML views, PDF and ePub downloads, according to the available data) and Abstracts Views on Vision4Press platform.
Data correspond to usage on the plateform after 2015. The current usage metrics is available 48-96 hours after online publication and is updated daily on week days.
Initial download of the metrics may take a while.