Open Access
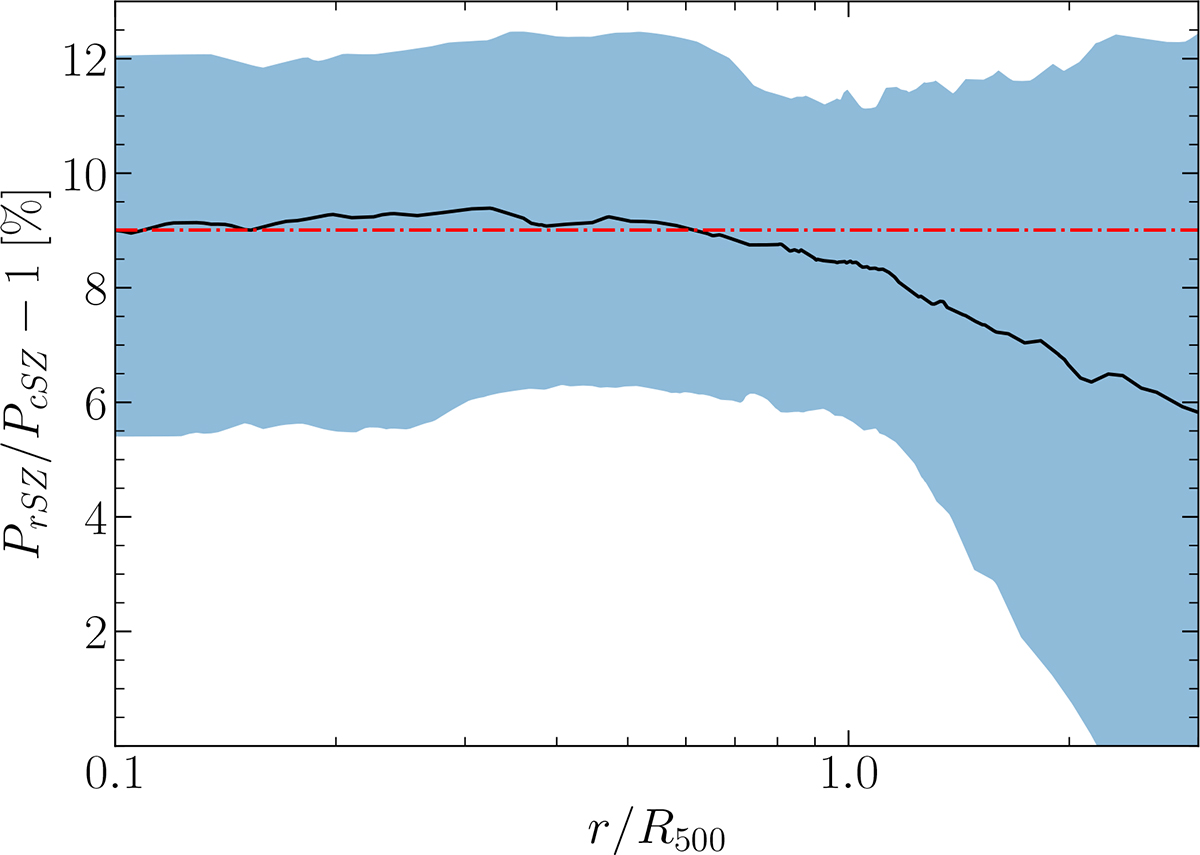
Fig. 4.
Download original image
Median fractional change in the pressure profiles between rSZ and cSZ models. The median at 0.1R500 is shown as a visual reference with the dash-dotted red line, while the blue interval encompasses the 16th–84th percentile range.
Current usage metrics show cumulative count of Article Views (full-text article views including HTML views, PDF and ePub downloads, according to the available data) and Abstracts Views on Vision4Press platform.
Data correspond to usage on the plateform after 2015. The current usage metrics is available 48-96 hours after online publication and is updated daily on week days.
Initial download of the metrics may take a while.