Fig. 7.
Download original image
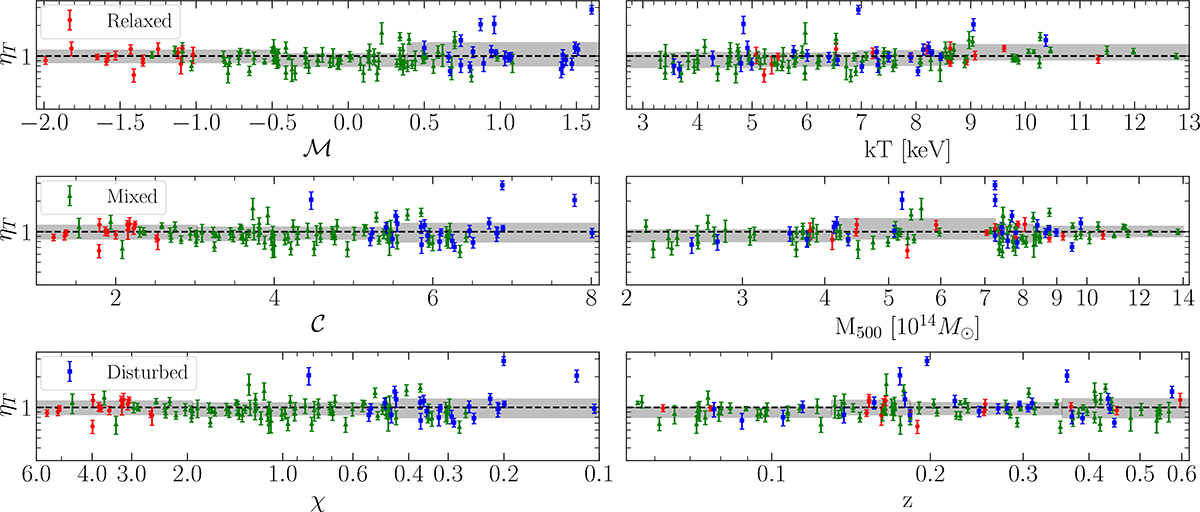
Distribution of ηT values (with 1σ error bars) against cluster morphological indicators ℳ, 𝒞, χ (upper to lower left panels, respectively) and cluster temperatures, masses, and redshifts (right panels). Dynamical classes of Campitiello et al. (2022) are shown as red circles (relaxed), green triangles (mixed), and blue squares (disturbed). Shaded grey envelopes denote the 16th–84th percentile dispersion dividing the sample in quartiles. The x axis in the χ panel is reversed, to preserve the same relaxation ordering of ℳ and 𝒞.
Current usage metrics show cumulative count of Article Views (full-text article views including HTML views, PDF and ePub downloads, according to the available data) and Abstracts Views on Vision4Press platform.
Data correspond to usage on the plateform after 2015. The current usage metrics is available 48-96 hours after online publication and is updated daily on week days.
Initial download of the metrics may take a while.