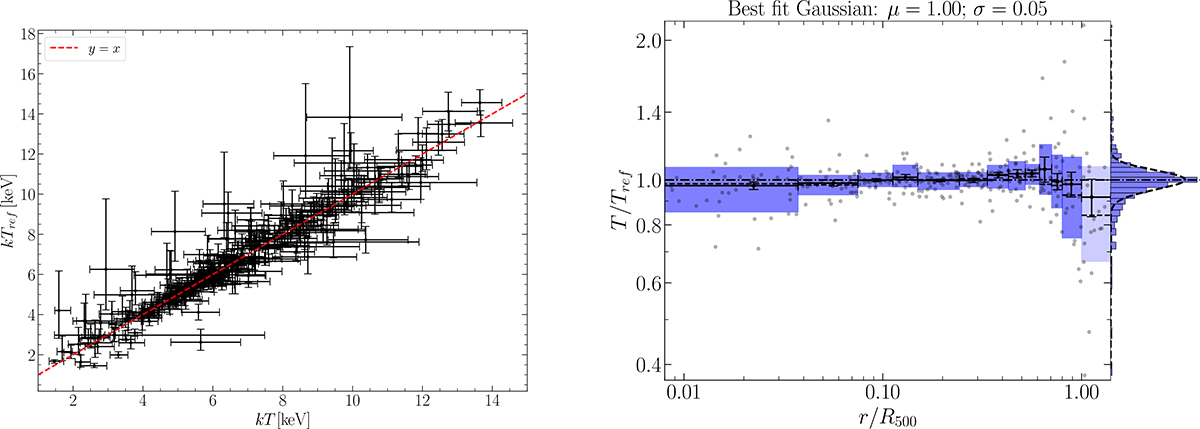
Fig. A.1.
Download original image
(Left panel): Comparison between the CHEX-MATE pipeline temperature (Tref) and the results of this work, with 1σ error bars and the equality line in dashed red. (Right panel): Ratios between the temperature estimates (grey dots) as a function of the radial distance from the cluster centres. The overall distribution is shown in the right marginal plot, with a Gaussian fit. Dark blue areas show the 16th–84th percentile range in the radial binning of this work. The bin mean (with its standard uncertainty) and median values are shown with black dots (with error bars) and dashed segments. As a visual reference, the y = 1 line is shown with a dash-dotted line.
Current usage metrics show cumulative count of Article Views (full-text article views including HTML views, PDF and ePub downloads, according to the available data) and Abstracts Views on Vision4Press platform.
Data correspond to usage on the plateform after 2015. The current usage metrics is available 48-96 hours after online publication and is updated daily on week days.
Initial download of the metrics may take a while.