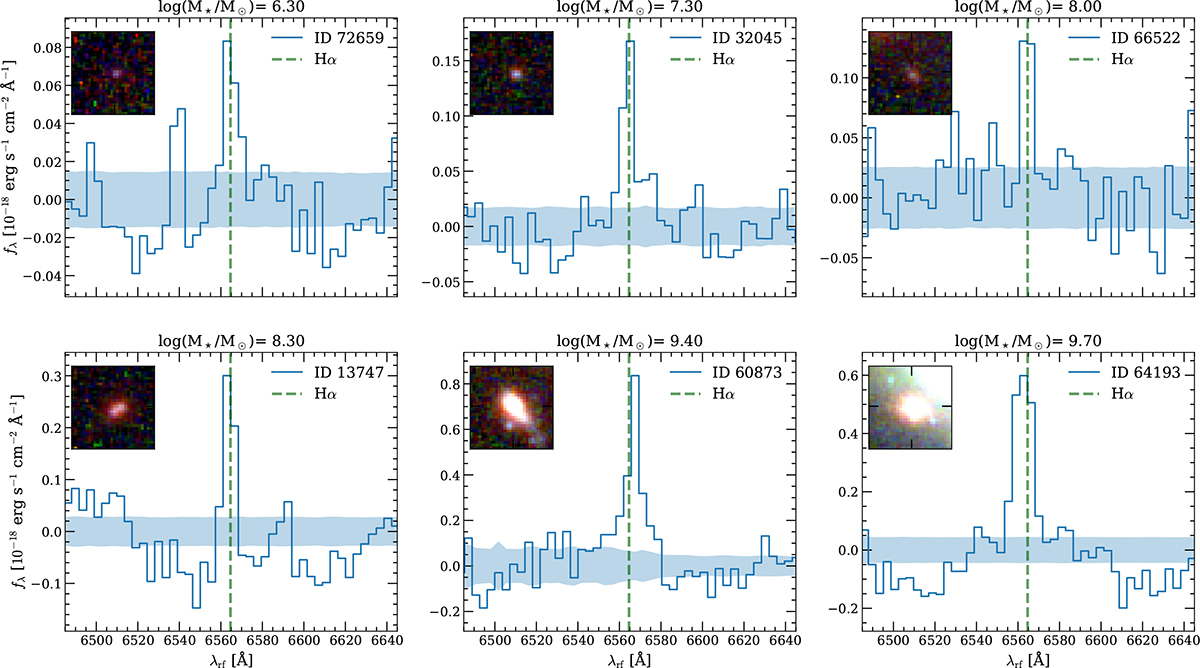
Fig. 1.
Download original image
F356W grism spectra for six Hα emitters in our sample. At the top of each panel, we report the stellar mass of the galaxy. The shaded region shows the uncertainty on the flux, and the 1.5″ × 1.5″ insets show false-color rest-frame optical RGB images constructed from NIRCam F115W/F200W/F356W. The green and brown lines highlight the Hαλ6564.6 and [N II] λλ6549.9, 6585.4 wavelengths, respectively.
Current usage metrics show cumulative count of Article Views (full-text article views including HTML views, PDF and ePub downloads, according to the available data) and Abstracts Views on Vision4Press platform.
Data correspond to usage on the plateform after 2015. The current usage metrics is available 48-96 hours after online publication and is updated daily on week days.
Initial download of the metrics may take a while.