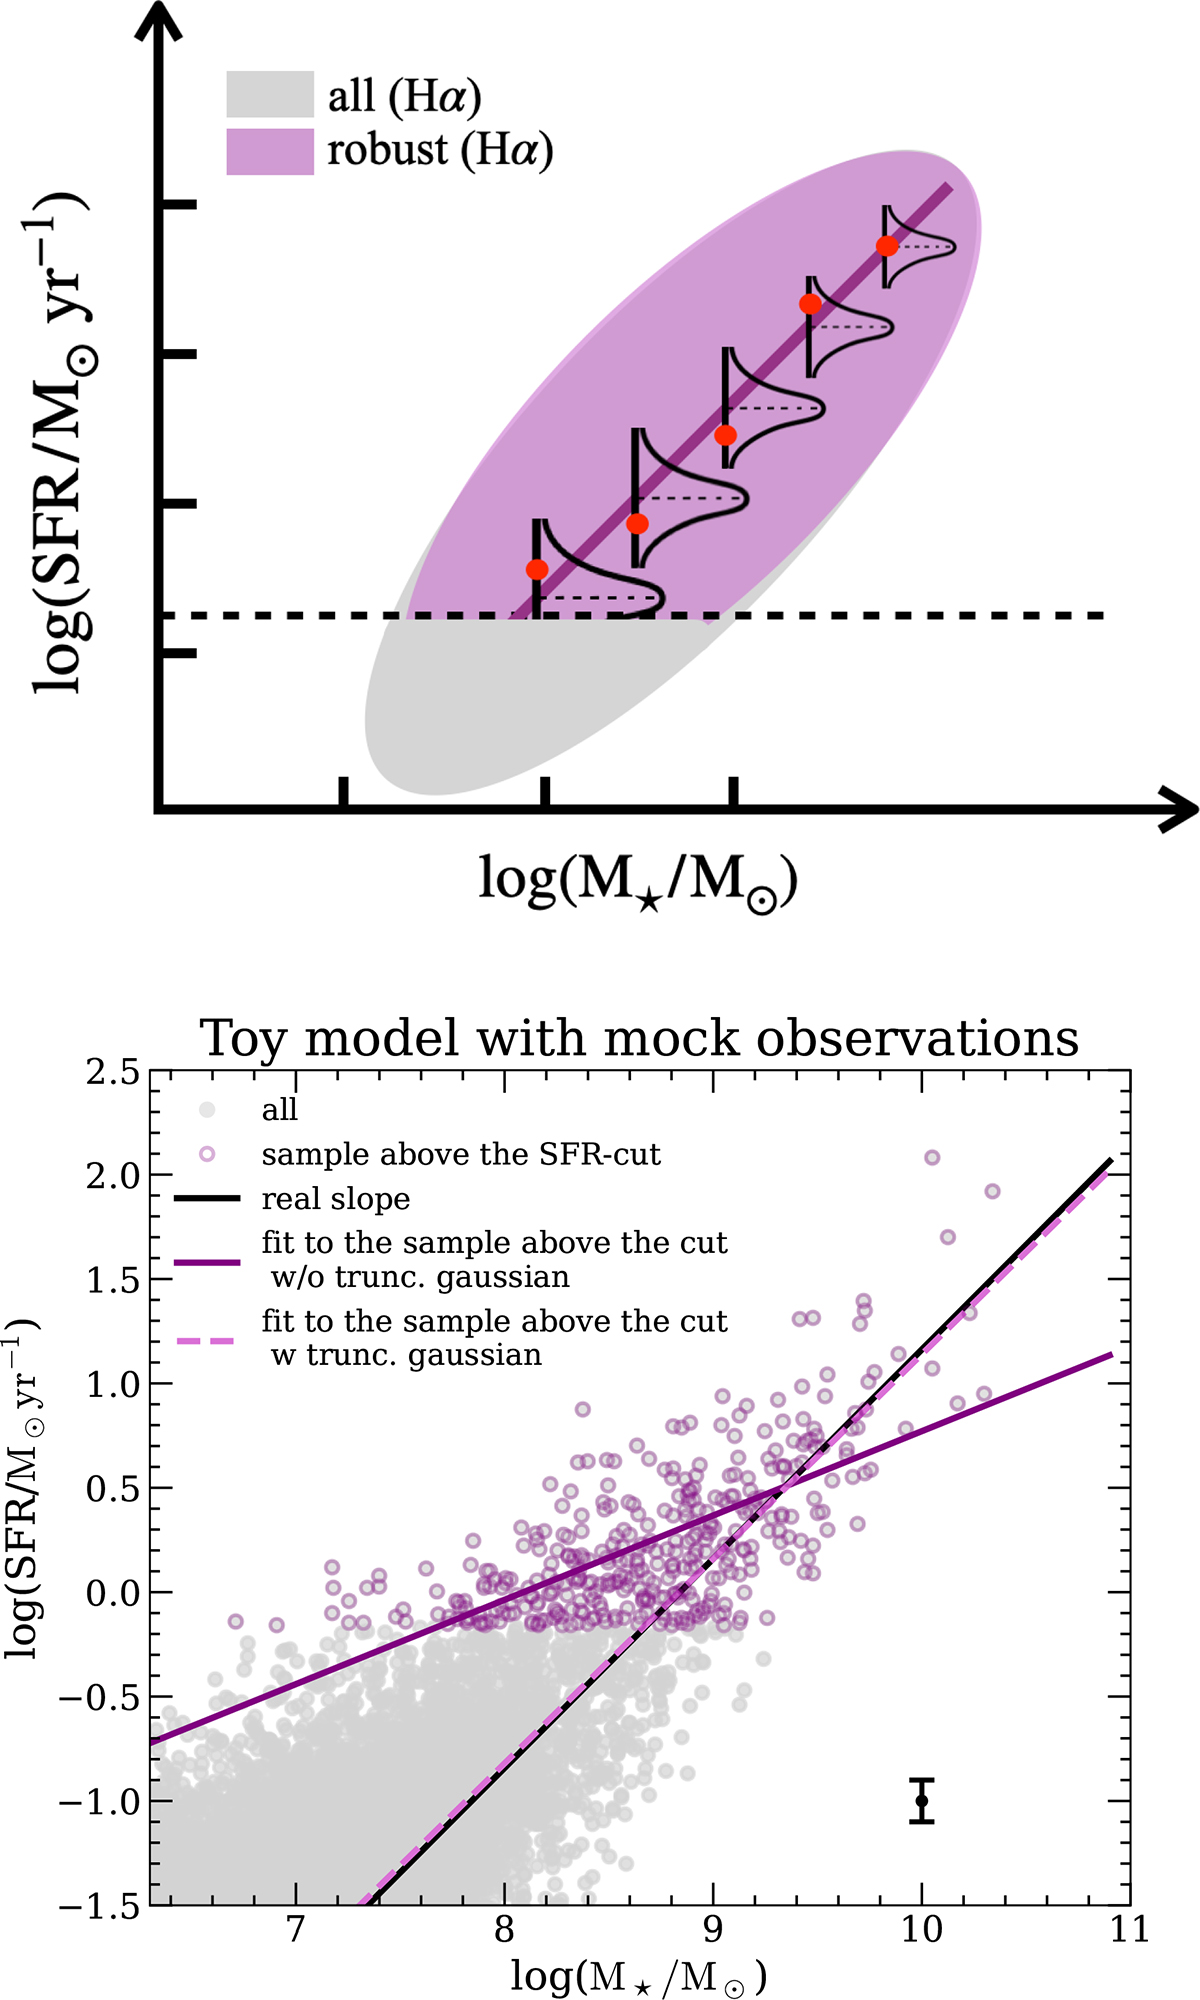
Fig. 5.
Download original image
Top: Model we used to describe the observed SFMS. The gray cloud represents all the HAEs in ALT, while the pink one is the observed sample after applying the selection criteria for robustness. Red points are the observed SFR, whose probability at fixed stellar mass is modeled using a truncated normal distribution that can be mass dependent. The normal distributions are centered in the SFR values predicted using the observed stellar masses and Eq. (2) whose parameters are explored within the MCMC sampling. Bottom: Toy model results. Mock observations generated sampling the stellar mass function from Weibel et al. (2024) with n_samples = 30 000. Gray dots show the entire sample, purple circles are galaxies with SFR > 0.7 M⊙/yr. The solid black line is the fit to the entire sample, while pink dashed and purple solid lines respectively show the fits with and without truncated normal distributions in the Bayesian model. The error bar in the bottom right is the 0.1 dex uncertainty on the SFR for each mock observation, corresponding to the average star formation rate uncertainty derived from observational data.
Current usage metrics show cumulative count of Article Views (full-text article views including HTML views, PDF and ePub downloads, according to the available data) and Abstracts Views on Vision4Press platform.
Data correspond to usage on the plateform after 2015. The current usage metrics is available 48-96 hours after online publication and is updated daily on week days.
Initial download of the metrics may take a while.