Fig. 6.
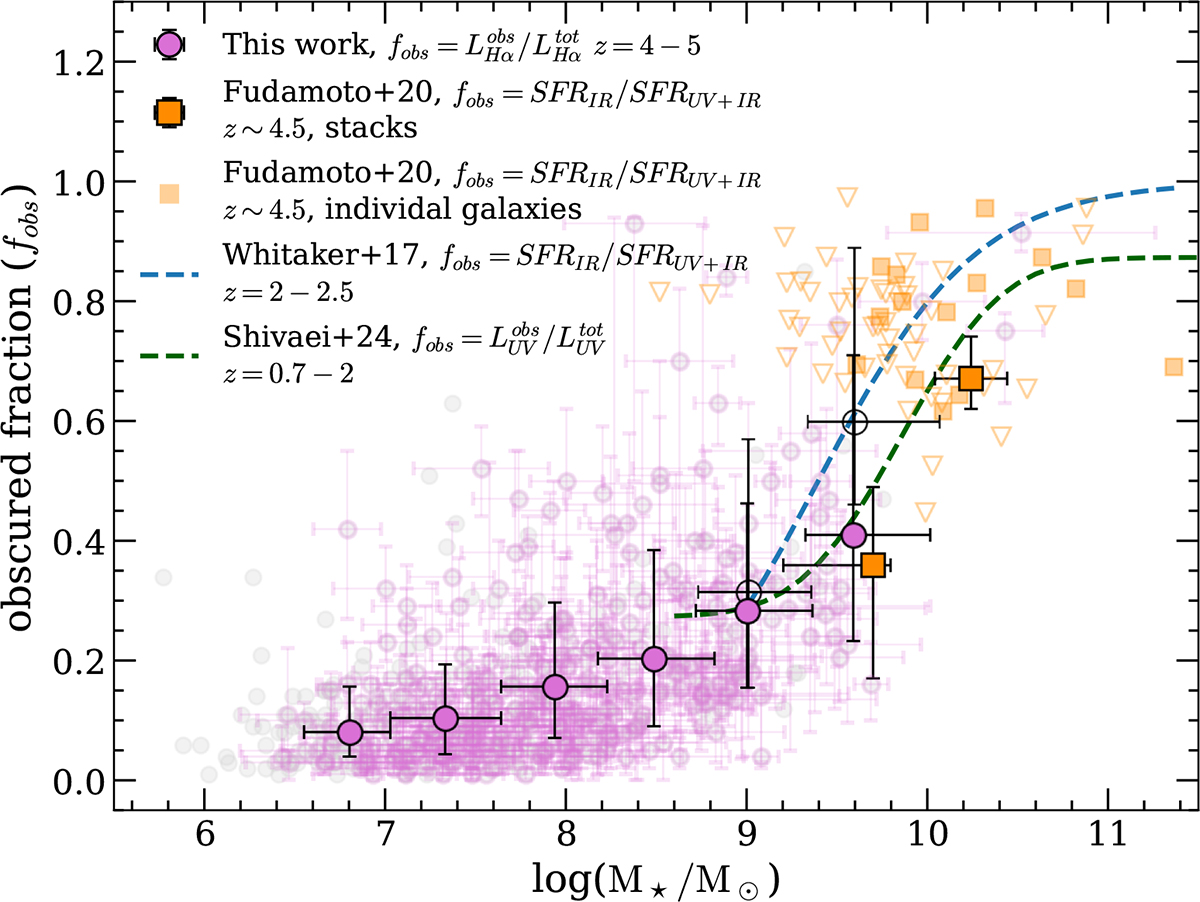
Download original image
Obscured star formation as a function of the stellar mass. The fraction of dust attenuated Hα emission, i.e., the ratio of the obscured and total Hα luminosity, as a function of stellar mass for the ALT sample. In gray is the parent Hα sample, while highlighted in pink is the robust one. Median values in each mass bin are shown as filled circles. Empty markers show obscured Hα fraction once we account for enhanced dust attenuation in high-mass galaxies (see Sect. 5.4). As a comparison, we show the fraction of obscured star formation for galaxies at 2 < z < 2.5 from Whitaker et al. (2017, blue), at 0.7 < z < 2 from Shivaei et al. (2024, green), and at z ∼ 4.5 ALPINE galaxies from Fudamoto et al. (2020, orange), with squares showing individual FIR continuum detections at 4 < z < 5 and triangles the 3σ upper limits for IR non detections. Filled squares show stacks in 2 mass bins at z ∼ 4.5.
Current usage metrics show cumulative count of Article Views (full-text article views including HTML views, PDF and ePub downloads, according to the available data) and Abstracts Views on Vision4Press platform.
Data correspond to usage on the plateform after 2015. The current usage metrics is available 48-96 hours after online publication and is updated daily on week days.
Initial download of the metrics may take a while.