Fig. 7.
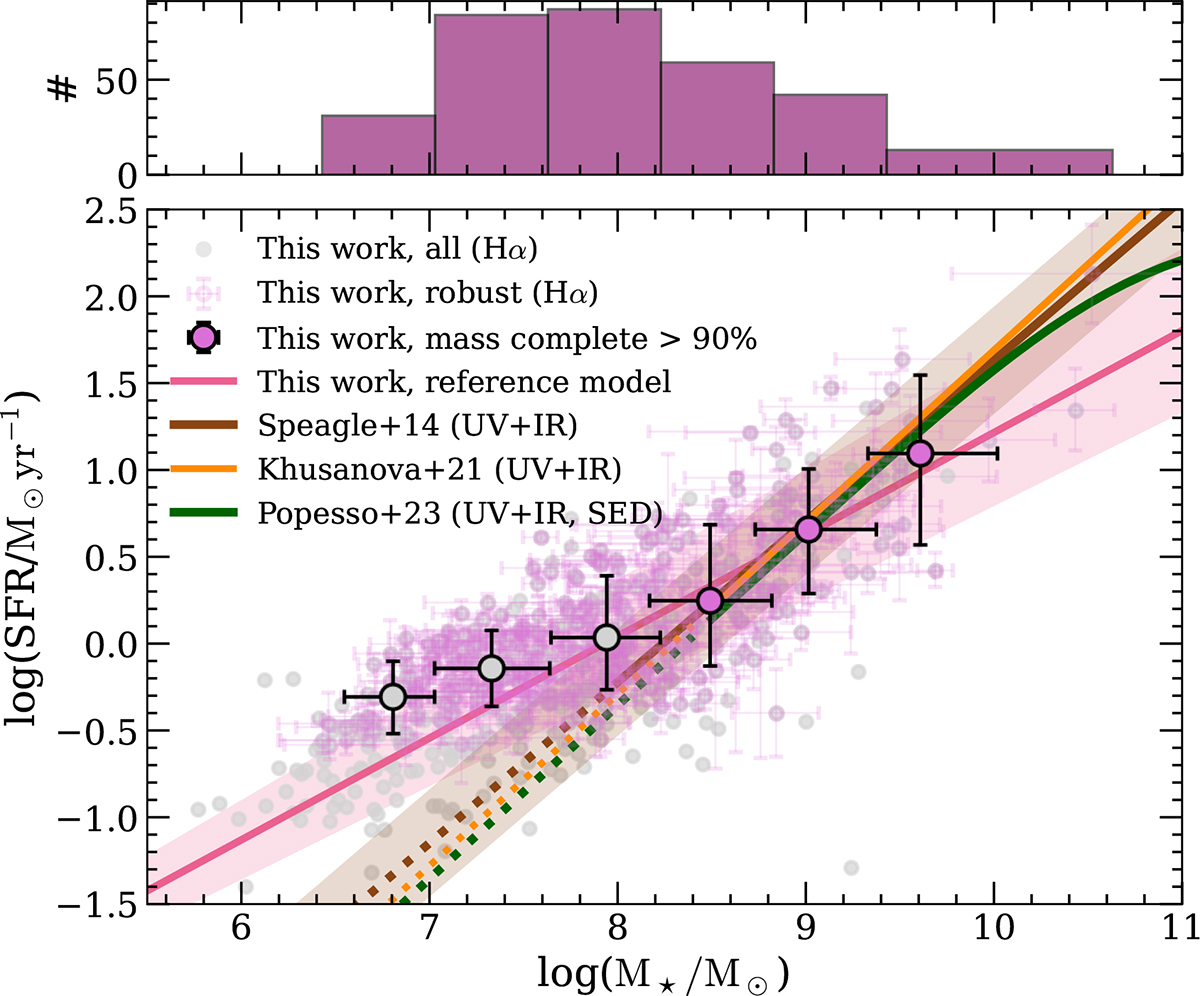
Download original image
SFR–M★ relation at 3.7 < z < 5.1. In gray is the entire ALT Hα sample, while highlighted in pink is the robust subsample. Circles show the median value when binning in stellar mass (upper panel). We are > 90% mass complete for galaxies with log(M★/M⊙) > 8.5 (filled circles). For reference, we show the SFMS fits by Speagle et al. (2014, together with its 0.3 dex scatter) and Popesso et al. (2023) from a compilation of literature observations and the fit by Khusanova et al. (2021) from ALMA-ALPINE observations. Dotted lines mark extrapolations to these relations based on their lower limits on M★. Solid pink line and shaded region denote respectively the best-fit line and 1σ interval about the SFMS using the reference model that accounts for the selection function (see Sect. 3.3).
Current usage metrics show cumulative count of Article Views (full-text article views including HTML views, PDF and ePub downloads, according to the available data) and Abstracts Views on Vision4Press platform.
Data correspond to usage on the plateform after 2015. The current usage metrics is available 48-96 hours after online publication and is updated daily on week days.
Initial download of the metrics may take a while.