Fig. 4
Download original image
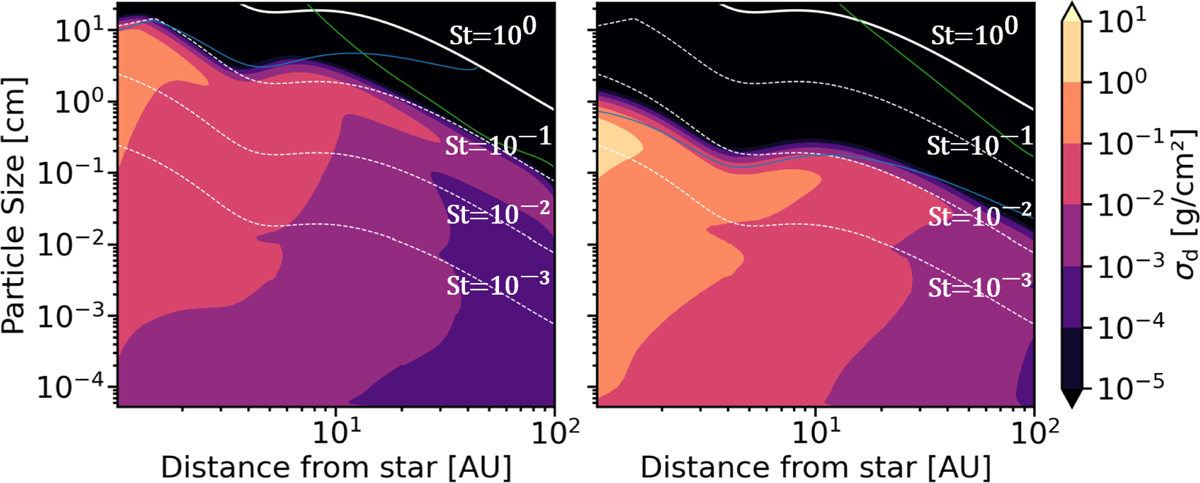
Distribution of dust as a function of radial distance and particle size at t=0.30 Myr for run_fid (left) and run_frag (right). The color bar represents the surface density of dust per logarithmic mass interval. The green line is the drift limit (Eq. (14)), whereas the blue line is the fragmentation limit (Eq. (15)). The four white lines correspond to St=[10−3, 10−2, 10−1, 100].
Current usage metrics show cumulative count of Article Views (full-text article views including HTML views, PDF and ePub downloads, according to the available data) and Abstracts Views on Vision4Press platform.
Data correspond to usage on the plateform after 2015. The current usage metrics is available 48-96 hours after online publication and is updated daily on week days.
Initial download of the metrics may take a while.