| Issue |
A&A
Volume 707, March 2026
|
|
|---|---|---|
| Article Number | A223 | |
| Number of page(s) | 15 | |
| Section | Planets, planetary systems, and small bodies | |
| DOI | https://doi.org/10.1051/0004-6361/202557793 | |
| Published online | 12 March 2026 | |
Effects of stellar X-ray photoevaporation on planetesimal formation via the streaming instability
1
Institute for Astronomy, School of Physics, Zhejiang University,
Hangzhou
310058,
China
2
Max Planck Institute for Solar System Research,
Justus-von-Liebig-Weg 3,
37077
Göttingen,
Germany
3
University Observatory, Faculty of Physics, Ludwig-Maximilians-Universität München,
Scheinerstr. 1,
81679
Munich,
Germany
4
Department of Physics and Astronomy, University of Nevada,
4505 South Maryland Parkway, Las Vegas,
NV 89154,
USA
5
Department of Astrophysics, American Museum of Natural History,
200 Central Park West,
New York,
NY 10024,
USA
6
Shanghai Astronomical Observatory, Chinese Academy of Sciences,
Nandan Rd 80th,
Shanghai
200030,
China
★ Corresponding author: This email address is being protected from spambots. You need JavaScript enabled to view it.
Received:
22
October
2025
Accepted:
23
January
2026
Abstract
Context. The formation of planetesimals via the streaming instability (SI) is a crucial step in planet formation, yet its triggering conditions and efficiency are highly sensitive to both disk properties and specific evolutionary processes.
Aims. We aim to study the planetesimal formation via the SI, driven by the stellar X-ray photoevaporation during the late stages of disk dispersal, and to quantify its dependence on key disk and stellar parameters.
Methods. We used the DustPy code to simulate the dust evolution, including coagulation, fragmentation, and radial drift, in a viscously accreting disk undergoing stellar X-ray photoevaporation.
Results. Stellar X-rays drive the disk dispersal, opening a cavity at orbital radii of a few au and inducing the formation of an associated local pressure maximum. This pressure maximum acts as a trap for radially drifting dust, therefore enhancing the dust density to the critical level required to initiate the streaming instability and the subsequent collapse into planetesimals. The fiducial model produces 31.4 M⊕ of planetesimals with an initial dust to final planetesimal conversion efficiency of 20.4%. This pathway is most efficient in larger disks with higher metallicities, lower viscosities, higher dust fragmentation threshold velocities, and/or around stars with higher X-ray luminosities.
Conclusions. This work demonstrates that stellar X-ray photoevaporation is a robust and feasible mechanism for triggering planetesimal formation via the SI during the final clearing phase of protoplanetary disk evolution.
Key words: methods: numerical / planets and satellites: formation / protoplanetary disks
© The Authors 2026
 Open Access article, published by EDP Sciences, under the terms of the Creative Commons Attribution License (https://creativecommons.org/licenses/by/4.0), which permits unrestricted use, distribution, and reproduction in any medium, provided the original work is properly cited.
This article is published in open access under the Subscribe to Open model. This email address is being protected from spambots. You need JavaScript enabled to view it. to support open access publication.
1 Introduction
Planet formation remains one of the most challenging problems in modern astrophysics (Safronov 1972; Lissauer 1993; Pollack et al. 1996). Over the past three decades, exoplanet surveys using radial velocity, transit, microlensing, and direct imaging techniques have demonstrated that planetary systems are a common outcome of star formation, with the population of detected planets spanning a wide range of masses and orbital architectures (Cassan et al. 2012; Batalha et al. 2013; Mulders et al. 2018; Zhu & Dong 2021). The diversity of these systems – from compact super-Earth chains to distant gas giants – provides crucial constraints on the physics of protoplanetary disk evolution and planet formation (see reviews of Liu & Ji 2020; Drążkowska et al. 2023).
The core accretion scenario offers a broadly successful framework for linking these observations to the final planetary architectures (Pollack et al. 1996; Ida & Lin 2004; Mordasini et al. 2012; Bitsch et al. 2015; Liu et al. 2019; Liu & Ji 2020; Emsenhuber et al. 2021; Pan et al. 2025). In this picture, micron-sized dust particles coagulate into millimeter-centimeter pebbles (Blum & Wurm 2008; Birnstiel et al. 2012; Pinilla et al. 2012; Birnstiel et al. 2016), but further growth is uncertain: laboratory experiments (Blum & Münch 1993; Blum & Wurm 2000, 2008; Güttler et al. 2010) and numerical simulations (Brauer et al. 2008; Zsom et al. 2010; Okuzumi et al. 2012; Kataoka et al. 2013; Drążkowska et al. 2016) all indicate that bouncing, fragmentation, and rapid inward drift prevent pebbles from directly forming kilometer-sized planetesimals. These barriers are most severe inside ice lines or in disks with low dust-to-gas ratios, where pebbles drift inward before significant growth can occur (Drążkowska et al. 2023). The conversion of millimeter-sized solids into planetesimals therefore remains one of the least understood stages of planet formation (Johansen et al. 2014; Liu & Ji 2020; Drążkowska et al. 2023), demanding an additional, efficient concentration mechanism (Birnstiel et al. 2016; Drążkowska et al. 2016).
The streaming instability (SI) is widely considered a leading candidate for overcoming these barriers (Youdin & Goodman 2005; Johansen et al. 2007; Bai & Stone 2010; Carrera et al. 2015; Li & Youdin 2021; Lim et al. 2024, 2025a,b). By tapping the relative motion between gas and solids, the SI concentrates drifting solids into dense filaments that can collapse gravitationally into planetesimals. Its activation, however, is sensitive to the local dust-to-gas ratio, particles’ Stokes number, and disk turbulence (Bai & Stone 2010; Yang et al. 2017; Drążkowska et al. 2014; Lim et al. 2024). A local dust-to-gas ratio of a few times 10−2 is typically required (Johansen et al. 2009b; Carrera et al. 2015; Drążkowska et al. 2016; Liu & Ji 2020). This motivates the question of how and where protoplanetary disks can enhance the dust-to-gas ratio sufficiently to trigger the SI.
High-resolution imaging of protoplanetary disks has revealed ubiquitous substructures – such as rings, gaps, and cavities – which are interpreted as pieces of evidence that dust growth and radial drift are already actively reshaping disks at very young ages (Huang et al. 2018; Dullemond et al. 2018; Andrews 2020). Pressure bumps are thought to be natural sites for halting dust drift and locally boosting the metallicity. They may arise from gaps opened by massive planets (Kobayashi et al. 2012; Zhu et al. 2012; Gonzalez et al. 2015; Eriksson et al. 2020), at the inner edges of magnetically inactive dead zones (Varnière & Tagger 2006; Lyra et al. 2009; Dzyurkevich et al. 2010), from zonal flows generated by hydrodynamical or magnetic instabilities (Johansen et al. 2009a; Dittrich et al. 2013; Bai 2014; Raettig et al. 2015; Xu & Bai 2022; Lehmann & Lin 2025), in the ice line regions (Ida & Guillot 2016; Drążkowska & Alibert 2017; Schoonenberg & Ormel 2017), or at the outer edges of photoevaporative cavities (Carrera et al. 2017; Ercolano et al. 2017). Such photoevaporative cavity edges may also influence planet migration through the associated positive density gradients, leading to outward “rebound” migration (Liu et al. 2025).
High-energy radiation, particularly X-rays from young stellar hosts, plays a critical role in clearing gas from protoplanetary disks during their late evolutionary stages (Owen et al. 2010, 2012; Ercolano et al. 2017; Wang & Goodman 2017; Jennings et al. 2018; Picogna et al. 2019). This radiation heats and ionizes the upper layers of disks, driving the photoevaporative winds that steadily deplete the gas. This process initially opens a cavity at orbital radii of a few au for a solar-mass star (closer in for a lower-mass star). As depletion continues, the cavity expands outward (Owen et al. 2010; Alexander et al. 2014; Ercolano & Pascucci 2017; Picogna et al. 2019). A local pressure maximum forms near the expanding cavity’s edge, which efficiently traps drifting dust (Pinilla et al. 2018; Gárate et al. 2021, 2023). This evolving pressure bump can enhance the local metallicity and trigger the SI, potentially facilitating late-stage planetesimal formation (Carrera et al. 2017; Ercolano et al. 2017). Similarly, Throop & Bally (2005) pointed out that the external photoevaporation from the nearby massive stars removes gas efficiently, while the dust population remains largely unaffected. This can also increase the disk dust-to-gas ratio.
This paper investigates whether stellar X-ray photoevaporation can produce the conditions required to trigger the SI and form planetesimals. We employed the DustPy code to couple models of viscous gas evolution with dust coagulation, fragmentation, and radial drift, explicitly including photoevaporation to simulate the formation and inside-out movement of a disk cavity with its associated pressure bumps. By applying established SI criteria to these evolving disks, we determined the circumstances under which the photoevaporation-driven dispersal promotes planetesimal formation.
Our paper is organized as follows. The model is introduced in Sect. 2. Our main results and parameter exploration are presented in Sect. 3. The implications and uncertainties are discussed in Sect. 4. The conclusions are drawn in Sect. 5.
2 Method
In this section, we introduce the basics of our model. The prescriptions of disk evolution, stellar X-ray photoevaporation, and planetesimal formation are described in Sects. 2.1, 2.2, and 2.3, respectively, whereas the simulation setup is given in Sect. 2.4.
2.1 Disk model
2.1.1 Gas component
The initial gas disk surface density is adopted from the self-similar solution of Lynden-Bell & Pringle (1974):
 (1)
where Mdisk is the onset gas disk mass, Rc is the disk characteristic radius, and r is the radial distance from the central star.
(1)
where Mdisk is the onset gas disk mass, Rc is the disk characteristic radius, and r is the radial distance from the central star.
Considering a passively irradiated disk with a constant irradiation angle of θ=0.05, the disk midplane temperature can be written as
 (2)
where
(2)
where  is the stellar luminosity, and σSB is the Stefan-Boltzmann constant. We chose a pre-main sequence solar mass central star with a stellar radius of R*=2 R⊙ and an effective temperature of Teff=5772 K.
The aspect ratio of the gas disk is therefore expressed as
 (3)
where cs is the isothermal gas sound speed,
(3)
where cs is the isothermal gas sound speed,  is the Keplerian velocity, G is the gravitational constant, M* is the stellar mass, and Hg is the gas disk scale height.
The gas pressure gradient parameter is defined as
 (4)
where Pg is the midplane gas pressure. Another useful dimensionless parameter that quantifies the gas pressure effect can be defined as
(4)
where Pg is the midplane gas pressure. Another useful dimensionless parameter that quantifies the gas pressure effect can be defined as
 (5)
where ηvK is the gas headwind velocity, indicating how much the azimuthal velocity of the gas deviates from the local Keplerian velocity.
(5)
where ηvK is the gas headwind velocity, indicating how much the azimuthal velocity of the gas deviates from the local Keplerian velocity.
The gas surface density is evolved through the viscous advection-diffusion equation (Lynden-Bell & Pringle 1974):
 (6)
where vg is the gas radial velocity and the sink term
(6)
where vg is the gas radial velocity and the sink term  is the gas surface density decay rate driven by the stellar X-ray radiation, the prescription of which is presented in Sect. 2.2.
The radial viscous velocity of the gas reads
 (7)
where v=αcsHg is the gas turbulent viscosity, and α is the dimensionless viscous parameter (Shakura & Sunyaev 1973).
(7)
where v=αcsHg is the gas turbulent viscosity, and α is the dimensionless viscous parameter (Shakura & Sunyaev 1973).
2.1.2 Dust transport
The advection-diffusion equation for the dust is given by Clarke & Pringle (1988):
![Mathematical equation: $\frac{\partial}{\partial t} \Sigma_{\mathrm{d}}+\frac{1}{r} \frac{\partial}{\partial r}\left[r \Sigma_{\mathrm{d}} v_{\mathrm{d}}-r D_{\mathrm{d}} \Sigma_{\mathrm{g}} \frac{\partial}{\partial r}\left(\frac{\Sigma_{\mathrm{d}}}{\Sigma_{\mathrm{g}}}\right)\right]=\dot{\Sigma}_{\mathrm{PE}, \mathrm{~d}}+\dot{\Sigma}_{\mathrm{plt}},$](/articles/aa/full_html/2026/03/aa57793-25/aa57793-25-eq11.png) (8)
where Σd and vd are the dust surface density and radial velocity, and
(8)
where Σd and vd are the dust surface density and radial velocity, and  and
and  are the dust mass-loss rates due to stellar X-ray photoevaporation and planetesimal formation, respectively. Since the dust coagulation is considered, in practice, the above transport equation is solved for dust with different mass bins. The disk metallicity is defined as Z=Σd/Σg.
The dust diffusivity taken from Youdin & Lithwick (2007) reads
 (9)
where Dg=δr cs Hg is the gas diffusivity and the dimensionless turbulent mixing parameter δr represents the turbulent diffusion in the radial direction. We set Dd=0 for most of our simulations. Including the dust diffusivity has a negligible effect on our results, since the timescale for dust to diffuse across its trapping region is much longer than that of planetesimal formation (see discussions in Sect. 4.2).
(9)
where Dg=δr cs Hg is the gas diffusivity and the dimensionless turbulent mixing parameter δr represents the turbulent diffusion in the radial direction. We set Dd=0 for most of our simulations. Including the dust diffusivity has a negligible effect on our results, since the timescale for dust to diffuse across its trapping region is much longer than that of planetesimal formation (see discussions in Sect. 4.2).
The aerodynamic size of the dust particles can be quantified by their Stokes number (Whipple 1972, 1973; Weidenschilling 1977):
 (10)
Here ad is the particle’s physical size, λmfp is the mean free path of disk gas, and ρ• is the particle’s internal density, chosen to be 1.67 g cm−3 as the default value.
(10)
Here ad is the particle’s physical size, λmfp is the mean free path of disk gas, and ρ• is the particle’s internal density, chosen to be 1.67 g cm−3 as the default value.
The dust radial velocity is given by
 (11)
with the maximum drift velocity vdrift,max=−ηvK.
(11)
with the maximum drift velocity vdrift,max=−ηvK.
2.1.3 Dust coagulation
In our simulations, the dust coagulation is calculated by solving the Smoluchowski equation (Smoluchowski 1916; Stammler & Birnstiel 2022). Basically, the dust initially grows through pairwise collisions until reaching the radial drift barrier or the fragmentation barrier.
Although our simulations employed the DustPy code (Stammler & Birnstiel 2022), which directly solves the full Smoluchowski equation, we briefly introduce the concepts of the fragmentation and drift barriers to provide physical intuition for the dust growth process. These barriers describe the limiting regimes in which dust growth is halted by either fragmentation or radial drift, and they are commonly used to interpret the size limits of dust in protoplanetary disks.
The dust growth, fragmentation, and radial drift have been investigated in-depth (Safronov 1972; Weidenschilling 1977, 1980; Nakagawa et al. 1986; Dominik & Tielens 1997; Brauer et al. 2008; Blum & Wurm 2008; Birnstiel et al. 2012).
Assuming that the relative velocity between dust is driven by disk turbulence  (Ormel & Cuzzi 2007), the growth timescale taken from Birnstiel et al. (2012) reads
 (12)
where ρd is the dust volume density, and ΩK=vK/r is the Keplerian frequency. The dust radial drift timescale adopted from Birnstiel et al. (2012) reads
(12)
where ρd is the dust volume density, and ΩK=vK/r is the Keplerian frequency. The dust radial drift timescale adopted from Birnstiel et al. (2012) reads
 (13)
When the drift timescale is shorter than the growth timescale, the in situ growth cannot proceed. By equating these two timescales, one can derive the particles’ Stokes number in the radial drift barrier as
(13)
When the drift timescale is shorter than the growth timescale, the in situ growth cannot proceed. By equating these two timescales, one can derive the particles’ Stokes number in the radial drift barrier as
 (14)
On the other hand, when the dust particles’ relative velocities exceed a specific threshold, they fragment during collisions rather than perfectly merge. This sets another limit on the size of the particles, referred to as the fragmentation barrier. The fragmentation barrier in the turbulence-driven regime is given by
(14)
On the other hand, when the dust particles’ relative velocities exceed a specific threshold, they fragment during collisions rather than perfectly merge. This sets another limit on the size of the particles, referred to as the fragmentation barrier. The fragmentation barrier in the turbulence-driven regime is given by
 (15)
where vfrag is the fragmentation threshold velocity and δt is the turbulent mixing parameter. In reality, the Stokes number of the largest particles can be approximated as St=min(Stfrag, Stdrift).
(15)
where vfrag is the fragmentation threshold velocity and δt is the turbulent mixing parameter. In reality, the Stokes number of the largest particles can be approximated as St=min(Stfrag, Stdrift).
It is worth noting that the turbulent mixing parameters are defined in three forms: δr, δt, and δz. For MRI-driven disk turbulence, which is approximately isotropic, angular momentum transport is roughly equivalent to mass diffusion (Johansen & Klahr 2005; Zhu et al. 2012; Zhou et al. 2022) (v ≃Dg), so that δr ≃ δt ≃ δz ≃ α. In our default models, we set δr=0, δt ≃ δz ≃ α, and explore the influences of these parameters in Sect. 4.2.
2.2 Stellar X-ray photoevaporation
Intense X-ray radiation from the young, active central star heats the upper layers of the disk, inducing the hot gas and dust to escape as a photoevaporative wind (Alexander et al. 2014; Ercolano & Pascucci 2017). In this work we focus on the stellar X-ray radiation, the influence of which is incorporated as the sink terms in Eqs. (6) and (8).
We adopt the normalized  profiles from Owen et al. (2012) for primordial disks and disks with inner holes. We also note that alternative prescriptions, such as that of Picogna et al. (2019), yield different radial mass-loss distributions due to differences in their hydrodynamic setups and thermochemical treatments. More recently, Sellek et al. (2024) find that Owen et al. (2012)’s prescription remains in good agreement with their radiation-hydrodynamic simulations. This provides the motivation for our choice of Owen et al. (2012)’s prescription in this work. Although these prescriptions differ in their detailed radial mass-loss profiles, a systematic exploration of how these differences may impact the disk dispersal and dust dynamics is beyond the scope of this study.
Owen et al. (2012) calculated the  profiles for both primordial disks and disks with inner holes, based on their radiation-hydrodynamical model.
![Mathematical equation: $\dot{M}_{\mathrm{PE}}=\left\{\begin{array}{rll} 1.65 & \times 10^{-8}\left(\frac{M_{\star}}{M_{\odot}}\right)^{-0.068} & \\ & \times\left(\frac{L_{\mathrm{X}}}{L_{\mathrm{X}, \odot}}\right)^{1.14} M_{\odot} \mathrm{yr}^{-1} & {[\text { primordial disk }]} \\ 1.27 & \times 10^{-8}\left(\frac{M_{\star}}{M_{\odot}}\right)^{-0.148} & \\ & \times\left(\frac{L_{\mathrm{X}}}{L_{\mathrm{X}, \odot}}\right)^{1.14} M_{\odot} \mathrm{yr}^{-1} & [\text{disk with inner hole,}\\ & &\quad \text {at}\ \left.r>r_{\text {hole }}\right] \end{array}\right.$](/articles/aa/full_html/2026/03/aa57793-25/aa57793-25-eq24.png) (16)
(16)
The typical X-ray luminosity of a solar-mass T Tauri star can be expressed as LX, ⊙=2.34 × 1030 erg s−1 (Preibisch et al. 2005). Taking into account the correlation between the X-ray luminosity of T Tauri stars and stellar mass (see Sect. 4.2 in Preibisch et al. 2005), the integrated gas mass-loss rate driven by the stellar X-ray photoevaporation can be written as
![Mathematical equation: $\dot{M}_{\mathrm{PE}}= \begin{cases}1.65 \times 10^{-8}\left(\frac{M_{\star}}{M_{\odot}}\right)^{1.57} & M_{\odot} \mathrm{yr}^{-1} & {[\text { primordial disk}],} \\ 1.27 \times 10^{-8}\left(\frac{M_{\star}}{M_{\odot}}\right)^{1.49} & M_{\odot} \mathrm{yr}^{-1} & \text { [disk with inner hole,} \\ & &\quad \text {at}\ \left.r>r_{\text {hole}}\right].\end{cases}$](/articles/aa/full_html/2026/03/aa57793-25/aa57793-25-eq25.png) (17)
(17)
For the primordial disks, the photoevaporative mass-loss rate  peaks at ∼2−3 au. After the cavity forms, we set the gas depletion rate at r<rhole to a constant to ensure rapid gas removal there. Since the inner disk does not participate in planetesimal formation, this treatment does not alter the final mass of planetesimals. We adopted a relatively high X-ray luminosity LX=6.15 × 1030 erg s−1=2.6 LX, ⊙ in our default model and assume that LX remains constant during the short disk dispersal phase. Our simulations are designed to follow the final dispersal of the disk. Choosing a higher LX, corresponding to a more X-ray-active young star (see Fig. 3 in Preibisch et al. 2005), allows the photoevaporation-driven clearing phase to complete within ∼1 Myr.
The stellar photoevaporation also influences the dust dynamics. Following Facchini et al. (2016) and Sellek et al. (2020), we assume that particles smaller than the entrained size, aent, can be blown away by the wind, where
 (18)
where
(18)
where  is the thermal velocity of the gas and
  corresponds to the disk geometric factor. For particles smaller than the entrained size aent, we set the dust mass-loss rate:
 (19)
where
(19)
where  is the dust mass-loss rate driven by the stellar X-ray photoevaporation within a specific dust mass bin i, fent is the entrained mass fraction, and Zi is the metallicity for that mass bin. Following Sellek et al. (2020), we set fent=1 in our simulations.
2.3 Streaming instability criterion and planetesimal formation
Several literature studies have investigated the critical condition for triggering the SI. The classical criterion for the onset of the SI is proposed by Youdin & Goodman (2005) through a linear stability analysis. They found that the SI criterion can be fulfilled when the midplane volume density ratio of dust-to-gas approaches unity. Their result laid the foundation for subsequent theoretical and numerical studies. Carrera et al. (2015) explored this issue by performing 2D numerical simulations and obtained the metallicity threshold Zcrit as a function of particles’ Stokes number. Later, Yang et al. (2017) reduced this clumping threshold with an improved numerical method. Li & Youdin (2021) further quantified how Zcrit(St) varied with simulation setups. They found that subsolar metallicity can already induce the dust clumping at St∼0.1-01, lower than previous results. However, their numerical study was only 2D and did not take into account disk turbulence. More recently, Lim et al. (2024) advanced the understanding of the SI condition by performing 3D stratified shearing box simulations that included both particles’ self-gravity and externally forced turbulence. Their work provides a more accurate threshold for evaluating the planetesimal formation in global disk models.
For the purpose of generality, here we list three SI criteria, ranging from the early linear analysis of Youdin & Goodman (2005) to the most updated numerical simulations of Lim et al. (2024). The influence of adopting different SI criteria on our study is discussed in Sect. 3.1.
To the zero order, the analytical SI criterion can be expressed as the midplane volume density ratio of dust-to-gas, where
 (20)
(20)
By explicitly quantifying how turbulence affects the SI-induced clumping, the new derived criteria from Lim et al. (2024) bridge the gap between idealized SI theory and turbulent disk environments. The εcrit criterion provided by Lim et al. (2024) reads
 (21)
Meanwhile, Lim et al. (2024) also provides the Zcrit criterion:
(21)
Meanwhile, Lim et al. (2024) also provides the Zcrit criterion:
 (22)
The above two criteria hold for particles with 0.01 ≤ St ≤ 0.1 and a disk turbulent level of 10−4 ≤ δt ≤ 10−3. We also use YG05, L24E, and L24Z to represent Eqs. (20), (21), and (22) hereafter.
(22)
The above two criteria hold for particles with 0.01 ≤ St ≤ 0.1 and a disk turbulent level of 10−4 ≤ δt ≤ 10−3. We also use YG05, L24E, and L24Z to represent Eqs. (20), (21), and (22) hereafter.
It is worth noting that L24Z (Eq. (22)) is derived at Π=0.05. Physically, a more decisive factor that sets the SI clumping should be Z/Π in the above equation (Sekiya & Onishi 2018). In our simulations that include the stellar X-ray photoevaporation, however, the Π value varies significantly across the disk and crosses zero at the outer cavity edge. This variability makes it impractical to apply a correction to the criterion directly. We therefore adopt the εcrit criterion of L24E (Eq. (21)), which shares the same physical basis as the Zcrit criterion of L24Z (Eq. (22)), and subsequently calculate the midplane density ratio in our 1D code to incorporate the effects of Π. A key advantage of L24E (Eq. (21)) is its ability to capture turbulence variations from the SI (specifically through Π) via the self-consistent modification of the dust scale height. The specific method is detailed below.
In the absence of the SI-induced dust concentration, the dust scale height adopted from Dubrulle et al. (1995) can be written as
 (23)
where δz is the vertical turbulent mixing parameter. SI can act as an additional turbulent source to affect the vertical dust distribution. Taking this into account, Carrera et al. (2025) and Eriksson et al. (2025) derive the effective dust scale height as
(23)
where δz is the vertical turbulent mixing parameter. SI can act as an additional turbulent source to affect the vertical dust distribution. Taking this into account, Carrera et al. (2025) and Eriksson et al. (2025) derive the effective dust scale height as
 (24)
Our simulation is 1D and only calculates the vertically integrated gas and dust quantities. To derive the volume density, the vertical distribution of the dust needs to be intrinsically assumed. Despite that the dust vertical distribution might not be Gaussian-like owing to the SI effect (Lim et al. 2024), we still assume that the dust midplane density approximately follows ρd ∝ Σd/Hd, and therefore,
(24)
Our simulation is 1D and only calculates the vertically integrated gas and dust quantities. To derive the volume density, the vertical distribution of the dust needs to be intrinsically assumed. Despite that the dust vertical distribution might not be Gaussian-like owing to the SI effect (Lim et al. 2024), we still assume that the dust midplane density approximately follows ρd ∝ Σd/Hd, and therefore,
 (25)
(25)
Let  , we can obtain
 (26)
(26)
We note that the aforementioned SI criteria are all derived from simulations based on single-size particles (see Bai & Stone 2010; Zhu & Yang 2021 for multispecies). In this study we consider the drift and coagulation of dust particles with a wide size range. We thus use the mass-weighted mean Stokes number to represent the bulk dust population, the formula of which can be written as
 (27)
where Sti and
(27)
where Sti and  are the corresponding particles’ Stokes number and mass density in the mass bin i. The Stokes number of the dust population can therefore be specified at any given t and r. We adopt Stmean for calculating εcrit and Hd.
Once ε ≥ εcrit is satisfied, we transform the dust into planetesimals via
 (28)
where tset=[ΩK /(1+St−1)]−1 is the settling time, which corresponds to the timescale on the formation of the SI filaments (Yang et al. 2017). We adopt this formula of tset to eliminate interference of particles with extremely large Stokes numbers, such as the particles within the inner cavity (see Fig. 1b, Sect. 3.1).
(28)
where tset=[ΩK /(1+St−1)]−1 is the settling time, which corresponds to the timescale on the formation of the SI filaments (Yang et al. 2017). We adopt this formula of tset to eliminate interference of particles with extremely large Stokes numbers, such as the particles within the inner cavity (see Fig. 1b, Sect. 3.1).
The planetesimal conversion efficiency, ζ, represents the fraction of dust converted into planetesimals per settling time. Numerically, if ζ is too large, the entire dust mass within a radial bin would be depleted within a single timestep, leading to numerical instability. Physically, once the SI condition is met, dust trapped in a pressure bump is expected to rapidly transform into planetesimals within dozens of settling times (tset). Given that tset is significantly shorter than the timescale for the movement of the photoevaporative cavity (∼103−105 yr), planetesimal formation should be efficient regardless of the adoption of ζ values across a broad parameter range. Based on the simulations of Simon et al. (2016) and following Schoonenberg et al. (2018), we set ζ=0.1. For completeness, we test several planetesimal formation prescriptions. Our fiducial model adopts the rate modified from Schoonenberg et al. (2018). We further examine the formulations by Drążkowska et al. (2016), which consider particles with St>0.01 and an efficiency parameter ζ=0.01, as well as the smooth transition function introduced by Miller et al. (2021) to determine the local planetesimal formation fraction. The resulting differences in the total planetesimal mass are minor, suggesting that our results are robust against the specific choice of the planetesimal formation formula.
We also note that although the SI criterion of L24E (Eq. (21)) is derived for particles with Stokes numbers in the range of ∼0.01−0.1, in our study the dominated dust population involved in planetesimal formation naturally falls within a similar Stokes number range constrained by the drift and fragmentation barriers. The particles’ mean Stokes number (Stmean) reaches only approximately a few tenths even during the late stages of disk evolution (see Fig. 1b, Sect. 3.1). Practically, we extrapolate the thresholds beyond their original Stokes number range. We also test this approach and find that the difference is minor when restricting the Stokes number to ∼0.01−0.1 compared to using the full-size domain.
Resultant planetesimal masses and dust-to-planetesimal conversion efficiencies.
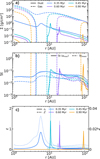 |
Fig. 1 Time and radial distance evolution of different quantities in the fiducial model. Panel a: gas (dashed lines) and dust (solid lines) surface density. Panel b: Stokes number of the maximum-size dust particles (solid lines) and the mean Stokes number of the dust particles (dashed lines) at each radial bin. Maximum-size refers to the size of the particle whose surface density is at the peak of the mass bins hereafter. Panel c: midplane density ratio ε (solid lines) and metallicity Z (dashed lines). |
2.4 Simulation setup
We used the DustPy (v1.0.5) code (Stammler & Birnstiel 2022) to study the radial evolution of the gas and the dust in protoplanetary disks, with the effects of viscous gas evolution, stellar X-ray photoevaporation, dust coagulation, fragmentation, and radial drift. The radial grid extended from 1–300 au with 256 logarithmically spaced grid cells. We additionally implemented the local refinement of the grids in the planetesimal formation region driven by stellar X-ray photoevaporation, spanning 5–20 au in the typical simulation setups. We verified that the final mass of planetesimals converged with this treatment and a higher radial grid resolution. We adopted 120 bins for dust mass, logarithmically from 10−12 to 105 g. The inner boundary conditions for the dust and gas densities were set to be constant gradients, whereas the outer boundary conditions were set to be floor values.
There are six key parameters in our model: the initial metallicity Z0, the stellar X-ray luminosity LX, the gas viscous parameter α, the initial gas disk mass Mdisk, the disk characteristic disk radius Rc, and the dust fragmentation threshold velocity vfrag. The default parameter values are listed in Table 1.
3 Results
In this section, we describe the results of the fiducial run in Sect. 3.1 and explore different model parameters from Sects. 3.2 to 3.6. Resultant planetesimal masses and dust-to-planetesimal conversion efficiencies are listed in Table 2, and the radial mass distributions of planetesimals are presented in Fig. 5.
3.1 Fiducial model
For the fiducial run (run_fid), we chose initial disk mass Mdisk=0.05 M⊙, characteristic disk radius Rc=60 au, viscous parameter α=10−4, initial metallicity Z0=0.01, fragmentation threshold velocity vfrag=5 m s−1, and stellar X-ray luminosity LX=2.6 LX, ⊙. The SI criterion is adopted from L24E (Eq. (21)).
Fig. 1 a shows the dust and gas disk evolution at different snapshots in run_fid. At t=0.35 Myr, an inner cavity opens at around 3 au. The outer edge of this inner cavity expands outward rapidly, reaching ∼10 au at t=0.45 Myr, and ∼100 au at t=0.90 Myr, respectively. Due to the dust radial drift and gas disk inside-out clearing, the dust gets accumulated and forms a ring-like structure at the edge of the inner disk cavity.
This can also be clearly seen in Fig. 2, which presents the synthetic dust continuum images at the 880 μm wavelength at three different epochs. At the early phase of t=0.25 Myr, the disk is driven by viscous evolution, and the dust is distributed relatively smoothly throughout the disk (see Fig. 2a). Fig. 2b shows the onset of photoevaporation-driven clearing, whereas in Fig. 2c, the inner cavity expands further out, with a strong dust emission at its outer edge. At the cavity’s edge, rapid gas clearing yields a local pressure bump, providing a natural site for dust concentration. The images were generated with RADMC-3D based on the one-dimensional DustPy outputs mapped onto two-dimensional axisymmetric grids. We adopted 38 logarithmically spaced dust-size bins between 5 μm and 17 cm, and assumed that the disk is passively heated by stellar irradiation. Dust temperatures were computed by Monte Carlo radiative transfer, and synthetic images were convolved to 880 μm, using the DSHARP opacity model (Birnstiel et al. 2018).
Fig. 1b demonstrates the Stokes number of the maximum-size dust particles (solid lines) and the mean Stokes number of the dust population (dashed lines). Overall, the St (amax) and Stmean values are higher near the outer edge of cavity than in the residual disk regions. This is because dust drifts slower near the pressure bump, enhancing the local coagulation. We also obtain that Stmean near the cavity’s edge is ∼0.05 at t=0.45 Myr, ∼0.1 at t=0.60 Myr, and ∼0.2 at t=0.90 Myr. Thus, Stmean remains largely below 0.1 within 30 au, which is the most relevant for planetesimal formation. This size is within the range where L24E (Eq. (21)) is valid. We also note that the sharp increase in Stmean just inside the cavity is caused by the floor values of the surface densities set in DustPy. These anomalous Stokes number values, as discussed in Sect. 2.3, can lead to the artificial formation of planetesimals in dust-depleted regions. Our adopted formula for tset (Eq. (28)) is designed to prevent this unphysical outcome.
Fig. 1c illustrates the ratios of dust-to-gas volume density ε and surface density Z. Due to dust trapping at the pressure bump, the disk metallicity Z gets largely elevated and exceeds 2−4%, whereas ε reaches the order of unity at the edge of the inner cavity as it sweeps outward.
We adopt the SI criterion from L24E (Eq. (21)). In the end, planetesimals with a total mass of 31.4 M⊕ are generated through this photoevaporation gas clearing process. The dust-to-planetesimal conversion efficiency is 20.4%, which indicates that 20.4% of the initial dust mass has been converted into planetesimals. The influences of alternative criteria of YG05 (Eq. (20)) and L24Z (Eq. (22)) on planetesimal formation are also tested. The total masses of resultant planetesimals show minor differences among all these criteria (≲ 10%). Thus, the εcrit criterion of L24E is used as the default in all following simulations.
Fig. 3a shows the evolution of the total dust mass (black line) and the planetesimal mass (red line) in run_fid. The blue bars represent the mass distribution of dust across different size bins within the pressure bump. The rapid rise of the planetesimal mass (red line) indicates that trapped dust particles are efficiently converted into planetesimals. This high formation efficiency results from the midplane volume density ratio ε being sufficiently high to trigger the SI at the cavity edge. Furthermore, after cavity opening, the dust population within the pressure bump is predominantly composed of particles with Stokes numbers of 0.01−0.1. The contribution of the dust particles within the pressure bump to the final planetesimal mass depends solely on the mass fraction of the trapped dust particles.
To conclude, run_fid shows that stellar X-ray photoevaporation opens a cavity at orbital radii of a few au. As the inner cavity sweeps inside-out, the dust particles accumulating at the cavity’s edge can trigger the SI and form planetesimals efficiently. In total, 30.5 M⊕ of planetesimals are generated at r=5−30 au within 1 Myr after the onset of stellar X-ray photoevaporation.
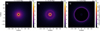 |
Fig. 2 Synthetic 880 μm continuum images from the fiducial model. Panel a: t=0.25 Myr, pre-cavity stage; Panel b: t=0.35 Myr, onset of photoevaporative cavity opening; Panel c: t=0.45 Myr, post-cavity stage. |
3.2 Metallicity
We investigated the influence of disk metallicity on planetesimal formation by increasing Z0 from 0.01 in run_fid to 0.02 in run_metal. The other parameters are kept identical as run_fid.
Fig. 3b shows total dust mass and planetesimal mass in run_metal. The initial dust mass is ∼300 M⊕, whereas 50 M⊕ remains when the photoevaporation opens a cavity at t=0.37 Myr. For comparison, in run_fid, the initial dust mass is ∼150 M⊕, whereas 37 M⊕ remains at t=0.37 Myr (see Fig. 3a).
We find that run_fid yields a final planetesimal mass of 31.4 M⊕, whereas in run_metal the final planetesimal mass reaches 48.2 M⊕. Clearly, doubling the initial metallicity indeed results in an increase in the final planetesimal mass. But the final planetesimal mass in run_metal is not twice as high as in run_fid. This is because the dust in the run_metal experiences more rapid growth (see Eq. (12)) compared to that in run_fid. In the early phase, the grown particles also get accreted by the central star at a faster rate. As a consequence, in both cases, the masses of retained dust at the onset of photoevaporative cavity are overall similar.
3.3 Stellar X-ray luminosity
Meanwhile, we also tested the effect of the stellar X-ray luminosity such that LX was set to be 1.0 LX, ⊙ in run_lumi rather than 2.6 LX, ⊙ in run_fid. The other parameters are the same as run_fid.
Table 2 shows that run_fid yields a final planetesimal mass of 31.4 M⊕ with an overall dust-to-planetesimal conversion efficiency of 20.4%, whereas run_lumi achieves a final planetesimal mass of only 1 M⊕ with a low conversion efficiency of 0.6%. As can be seen from Fig. 3c, only 3.8 M⊕ of dust is left when the photoevaporation opens a cavity at t=1.2 Myr in run_lumi.
The low stellar X-ray luminosity model results in a significant drop in the planetesimal mass and conversion efficiency. The strength of LX is crucial to determine the time for the photoevaporation-driven cavity formation. The disk around a star with a low stellar X-ray luminosity results in the cavityopening at a later time. By this time, a substantial amount of dust has already been accreted to the star. As a consequence, only a limited amount of dust remains available for the planetesimal formation. Therefore, we suggest that a relatively high LX is required to induce the generation of planetesimals at the gas clearing phase.
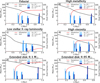 |
Fig. 3 Evolution of dust mass (black lines), planetesimal mass (red lines), and dust mass fraction within the pressure bump in three Stokes number bins (light blue for St<10−2, blue for 10−2 ≤ St ≤ 10−1, and deep blue for St>10−1), across four evolutionary stages: (i) pre-cavity, (ii) cavity at 10 au, (iii) cavity at 20 au, and (iv) cavity at 100 au. These panels show how initial conditions affect dust retention and planetesimal formation: Panel a: fiducial model (Z=0.01, LX=2.6 LX, ⊙, Mdisk=0.05 M⊙, Rc=60 au, α=10−4) serves as the baseline for comparison, showing balanced dust evolution and planetesimal production across the disk. Panel b: higher metallicity (Z=0.02) facilitates the retention of dust mass, thereby promoting planetesimal formation. Panel c: decreased X-ray luminosity (from 2.6 LX, ⊙ to 1.0 LX, ⊙) diminishes dust mass and consequently impedes planetesimal formation. Panel d: higher viscosity parameters (α=10−3, δt=10−4) induce gas replenishment from the outer disk, delay cavity opening, reduce the overall dust reservoir, and thus hinder planetesimal formation. Panel e: a more massive and extended disk (Mdisk=0.1 M⊙, Rc=120 au) prolongs dust retention, thereby extending the duration of planetesimal formation. Panel f: a less massive but extended disk (Mdisk=0.05 M⊙, Rc=120 au) lowers the inner-disk dust density, causing photoevaporation to open a cavity earlier. This makes more dust retained at the onset of photoevaporative cavity, which also provides more building blocks for planetesimal formation. |
3.4 Viscosity
Disk viscosity, parameterized by α, drives the global evolution of the protoplanetary disk. We focus on isolating the role of viscosity α in global disk evolution and that of the turbulent mixing parameter δt in dust coagulation. In other words, we treat α and δt differently. In run_alpha we only varied α from 10−4 to 10−3 whereas the turbulent mixing parameter δt was still kept the same. Thus, the particles’ Stokes number set by the fragmentation limit is the same as in run_fid.
Fig. 3d reveals that at a high α of 10−3, owing to more efficient angular momentum transport, the gas from the outer disk region replenishes the inner disk region at a fast pace. The cavity is opened at a later time of 0.45 Myr in run_alpha. As a result, a smaller amount of dust is left by this time and eventually leads to less planetesimal formation. Table 2 shows that the planetesimal mass decreases from 31.4 M⊕ in run_fid to 14.6 M⊕ in run_alpha.
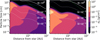 |
Fig. 4 Distribution of dust as a function of radial distance and particle size at t=0.30 Myr for run_fid (left) and run_frag (right). The color bar represents the surface density of dust per logarithmic mass interval. The green line is the drift limit (Eq. (14)), whereas the blue line is the fragmentation limit (Eq. (15)). The four white lines correspond to St=[10−3, 10−2, 10−1, 100]. |
3.5 Disk radius
The disk size is also a key factor that affects the gas and dust evolution and planetesimal formation. In run_fid, the characteristic disk radius Rc was set to be 60 au. Here we performed two additional sets of simulations to explore the influence of disk size. In run_dsize1, we kept Σg0 at 1 au the same as that of run_fid and increased Rc to 120 au. In such a case the initial disk mass increased to 0.1 M⊙. On the other hand, in run_dsize2, the total disk mass was still kept the same as 0.05 M⊙, whereas Rc was increased to 120 au. This configuration leads to an overall lower Σg 0 in the inner disk region.
Figs. 3e and f depict the evolution of dust masses and planetesimal masses in these two cases. The disk is more massive, and a higher proportion of dust mass resides in the outer disk region in run_dsize1 compared to run_fid. Since the gas density remains approximately the same in the inner disk region for run_fid and run_dsize1, the photoevaporative cavity forms at a similar time. In run_dsize1, the residual dust mass reaches ∼144 M⊕ at this cavity-opening time (see Fig. 3e). This leads to a higher planetesimal mass and conversion efficiency in the end.
On the other hand, run_dsize2 refers to a circumstance in which the gas mass is more readily distributed at further out disk regions. For run_dsize2, the gas density in the inner disk region is lower, and the photoevaporation opens a cavity at an earlier time of 0.18 Myr compared to run_fid (see Fig. 3f). This makes more dust retained at the onset of photoevaporative cavity, which also provides more building blocks for planetesimal formation.
As can be seen from Table 2, the conversion efficiencies in the above two models are quite similar, but both are much higher than run_fid. This again indicates that regardless of the detailed treatment of Σg or Mdisk, a disk with a larger size promotes the dust retention and thus subsequent planetesimal formation.
3.6 Dust fragmentation threshold velocity
To explore how the photoevaporation-driven planetesimal formation depends on the fragmentation-limited dust growth, we performed a simulation run_frag with a lower fragmentation threshold velocity of vfrag=1 m s−1. The other parameters are the same as run_fid.
Fig. 4 shows the distribution of dust as a function of radial distance and particle size at t=0.30 Myr for run_fid (left) and run_frag (right). It is evident that the particles’ Stokes number in run_fid is more than one order of magnitude larger than that in run_frag. Because the growth is limited by fragmentation, the largest particles reach a lower Stokes number when the fragmentation threshold is lower. Such small particles are more strongly coupled to the disk gas and hence drift more slowly. Consequently, they are less efficient at concentrating at the cavity’s edge, preventing the SI clumping and subsequent planetesimal formation. As can be seen from Table 2, no planetesimal can form during the gas clearing phase in run_frag.
Lim et al. (2025b) and Lim et al. (2025a) conducted 2D and 3D simulations of pure SI without external turbulence, respectively. The SI criteria presented in these two studies suggest lower thresholds for the onset of the SI. However, it is worth noting that their simulations indicate that ε needs to exceed 2 to trigger the SI for particles with St ≤ 10−3. Hence, even adopting a loose SI criterion from Lim et al. (2025a) (their Eq. (11)) without considering any turbulence, planetesimals are still unlikely to form at a relatively low fragmentation velocity.
Zhao et al. (2025) also concludes that vfrag=2 m s−1 is the minimum value that allows planetesimal formation, which is consistent with our results.
To facilitate a direct comparison among different models, Fig. 5 presents the radial mass distributions of planetesimals. To conclude, our results indicate that planetesimal formation is more efficient in larger disks with higher metallicities, lower viscosities, higher dust fragmentation threshold velocities, and/or around stars with higher X-ray luminosities.
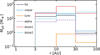 |
Fig. 5 Comparison of the radial mass distributions of planetesimals at different disk regions. The curves show the results for models with varying parameters: run_fid (black), run_metal (blue), run_lumi (orange), run_alpha (purple), run_dsize1 (red), and run_dsize2 (cyan). |
4 Discussions
We compare our work with the literature studies in Sect. 4.1. The influences of turbulent mixing parameters and pressure bumps produced by other mechanisms are presented in Sect. 4.2 and Sect. 4.3. Finally, the caveats in our model are discussed in Sect. 4.4.
4.1 Comparison with literature studies
We compare our results with those of Carrera et al. (2017) and Ercolano et al. (2017), who also explored planetesimal formation via the SI driven by the stellar X-ray photoevaporation. First, our treatment of dust evolution differs from theirs. Whereas Carrera et al. (2017) used a custom 1D viscous disk code with simplified dust prescriptions from Birnstiel et al. (2011), and Ercolano et al. (2017) employed the two-population model of Birnstiel et al. (2012) in their 1D code, we used the open-source DustPy code, which incorporates full multi-size dust evolution, including coagulation, fragmentation, and radial drift. The other difference is the treatment of stellar X-ray photoevaporation. Carrera et al. (2017) adopted the model from Gorti et al. (2015), who considered FUV-driven disk dispersal. This process triggers strong radial pressure gradients and enhances the dust pile-ups in the early phase of the disk lifetime. Ercolano et al. (2017), by contrast, used both X-ray and EUV-driven photoevaporation prescriptions derived from Owen et al. (2010, 2012)’s hydrodynamic simulations. Consequently, in their works, disk gas was removed more gradually, and photoevaporation primarily affected the inner region of the disk. While also adopting the stellar X-ray photoevaporation prescription from Owen et al. (2012), we additionally incorporate dust removal via photoevaporation, following the studies of Facchini et al. (2016) and Sellek et al. (2020).
There are two improvements in our study: the dust scale height calculation and the SI criterion. Whereas the previous studies relied on simplified estimates for the midplane density, we implement the correction from Carrera et al. (2025) and Eriksson et al. (2025) (our Eq. (24)), which self-consistently accounts for local turbulence and particle-size-dependent settling. This allows us to track dust evolution more precisely and significantly improves the accuracy of midplane density predictions. On the other hand, both Carrera et al. (2017) and Ercolano et al. (2017) adopted the classical threshold from the 2D unstratified simulations of Carrera et al. (2015). In this study, we instead adopt the latest criterion from Lim et al. (2024), which is based on 3D shearing box simulations and defines a critical midplane density ratio εcrit. This criterion considers the external turbulence, reflecting a more realistic condition for dust-gas interaction in vertically stratified disks.
Regarding the planetesimal formation, Carrera et al. (2017) reports up to 60 M⊕ of planetesimals form beyond the 100 au region and ∼16 M⊕ within the 100 au region. This high efficiency is a consequence of their adoption of strong FUV photoevaporation, which accelerates disk dispersal in the outer disk region and thus enhances dust concentration there. Conversely, Ercolano et al. (2017) finds planetesimal formation is less likely for the X-ray and EUV photoevaporation. Their model produces only 3 M⊕ under optimal conditions, due to rapid dust drift before gap formation and absence of strong pressure traps. Our results strike a middle ground. We demonstrate that stellar X-ray photoevaporation can still trigger localized SI when vertical dust settling is explicitly modeled. Because X-ray–driven winds have higher temperatures and thus smaller gravitational radii, the photoevaporative cavity opens at a smaller physical radius, allowing a larger fraction of solids to remain inside ∼100 au and thereby promoting planetesimal formation within ∼100 au. In our fiducial model, the total planetesimal mass can attain 30.5 M⊕ within the 30 au disk region. By adopting a more realistic SI criterion and a sophisticated dust evolution treatment, our study indicates that stellar X-ray photoevaporation can also be robust for SI-triggered planetesimal formation.
4.2 Turbulent mixing parameters
Several turbulent mixing parameters are used in this work: δr, δt and δz. Since disk turbulence can be nonisotropic, for example, driven by the vertical shear instability (VSI) (Nelson et al. 2013) or nonideal MHD (Yang et al. 2018), these parameters are not necessarily equal. As shown in Table 3, we conducted several simulations to investigate the influences of varying these parameters.
We performed a simulation run_rad, considering the effect of turbulent radial diffusion on dust and other parameters kept identical as run_fid. The dust diffusion timescale in run_rad is given by
 (29)
where Δ r ∼fHg is the pressure bump width at the onset of photoevaporative cavity, f is an order-unity factor, and Pr is the Keplerian period at the radial distance r.
(29)
where Δ r ∼fHg is the pressure bump width at the onset of photoevaporative cavity, f is an order-unity factor, and Pr is the Keplerian period at the radial distance r.
The photoevaporative cavity expansion timescale can be estimated as
 (30)
where
(30)
where  is the cavity expansion velocity, we emphasize that vcav does not correspond to the physical radial velocity of the gas; rather, it represents the expansion speed (for example, the phase velocity) of the photoevaporative cavity edge. Σcav ≃Ṁacc/(3πv) denotes the critical gas surface density at which viscous accretion balances photoevaporative mass loss, and
  corresponds to the critical gas accretion rate.
We note that, in estimating tcav, we have assumed  for simplicity. In practice, however, the gas accretion rate after the onset of cavity opening is typically smaller than the photoevaporative mass-loss rate. This implies that our estimate of tcav should be regarded as an upper limit. Therefore, we provide only an estimate that tcav ≲ tdiff. Although the exact reduction factor is difficult to quantify, this effect further reinforces our conclusion that radial diffusion cannot regulate the dust concentration at the cavity edge.
The dust particles settle and are subsequently converted into planetesimals on a timescale of:
 (31)
where St is the Stokes number of the maximum-size dust particles St (amax), which follows St(amax) ≃ 0.1(r/au)1/2 in the fiducial model.
(31)
where St is the Stokes number of the maximum-size dust particles St (amax), which follows St(amax) ≃ 0.1(r/au)1/2 in the fiducial model.
It can be noted that, for the particles with Stokes numbers of 0.01−0.1, tplt ≪ tcav<tdiff in run_rad. Once the SI criterion is met, dust is converted into planetesimals on a timescale much shorter than both the outward expansion of the photoevaporative cavity edge and the dust radial diffusion timescale. In other words, planetesimal formation is completed before the cavity edge recedes and before diffusion can significantly redistribute the dust. Consequently, we find no substantial difference in the total planetesimal mass formed between run_rad and run_fid (see Table 3).
We set δr=0, since radial diffusion does not regulate the peak dust-to-gas ratio in the low δr and high LX regime we focus on here. In this regime, photoevaporation drives the cavity edge outward on a timescale shorter than that required for dust radial diffusion to establish a local drift-diffusion equilibrium at the pressure maximum. More importantly, both tcav and tdiff are much longer than tplt. Once the SI is triggered, dust is rapidly converted into planetesimals, which naturally limits the peak dust-to-gas ratio.
Following our analysis of the impact of δr, we focus on the turbulent mixing parameter δt. Furthermore, to investigate the influence of δt, we conducted a control simulation, run_turb, based on run_alpha. This control run maintained all other parameters the same as run_alpha, but adjusted δt to 10−3 and vfrag to 15 m s−1. This ensures that the dust reaches a similar Stokes number at the fragmentation limit in two simulations.
We can therefore isolate the effect of δt. Through this comparison, we find that an increase in δt leads to a reduction of final planetesimal mass (from 14.6 M⊕ to 0.7 M⊕). This phenomenon can be attributed to the fact that the relative velocity between particles increases with δt, and dust grows much faster in this circumstance (see Eq. (12)). Consequently, the dust in the inner disk reaches the fragmentation limit at an earlier stage, leading to a less efficient retention of dust mass before the onset of photoevaporative cavity.
Similar to δt, δz also indirectly affects the planetesimal formation process by altering the dust growth timescale. We also established a control simulation run_vert based on run_fid. We reduced the value of δz from 10−4 in run_fid to 10−6 in run_vert. This reduction decreases the dust scale height, which both increases the midplane dust-to-gas and shortens the growth timescale. However, ε is not high enough to trigger the SI at early times, and fast growth leads to rapid depletion of dust mass. In the end we find that less dust is retained by the time that cavity opens, leading to a decrease in the final planetesimal mass from 31.4 M⊕ to 20.9 M⊕.
4.3 Local pressure bump
Apart from the inner cavity generated by stellar X-ray photoevaporation, the pressure bumps associated with substructures can also be produced by other mechanisms, such as gaps opened by massive planets (Kobayashi et al. 2012; Zhu et al. 2012; Gonzalez et al. 2015; Eriksson et al. 2020), at the inner edge of dead zones (Varnière & Tagger 2006; Lyra et al. 2009; Dzyurkevich et al. 2010), by zonal flows arising from hydrodynamic instabilities (Lehmann & Lin 2025) or magnetorotational turbulences (Johansen et al. 2009a), and in the ice line regions (Ida & Guillot 2016; Drążkowska & Alibert 2017; Schoonenberg & Ormel 2017). The pressure bumps act as traps that halt the inward drift and concentrate dust particles. Under favorable conditions, this process can trigger the SI and lead to planetesimal formation.
To further investigate the role of pressure bumps that may be produced by other mechanisms, we performed an additional simulation in which gaps were artificially imposed on the disk. The gap profile was adopted from Dullemond et al. (2018):
 (32)
where α0 is the disk viscosity, and F(r) is given by
(32)
where α0 is the disk viscosity, and F(r) is given by
![Mathematical equation: $F(r)=\exp \left[-A \exp \left(-\left(r-r_{0}\right)^{2} /\left(2 w^{2}\right)\right)\right],$](/articles/aa/full_html/2026/03/aa57793-25/aa57793-25-eq50.png) (33)
where A is the gap amplitude, r0 is the gap location, and w is the gap width.
(33)
where A is the gap amplitude, r0 is the gap location, and w is the gap width.
Fig. 6 shows three snapshots of the dust continuum images at 880 μm with two artificial bumps at 30 au and 60 au, where A=0.4 and w=0.1 r0. Other parameters are the same as run_fid. At t=0.38 Myr, the two wide gaps block the inward drifting of dust from the outer disk region before the onset of photoevaporative cavity (see Fig. 6a). We can see that the photoevaporative cavity forms and progressively moves outward. At t=0.60 Myr the cavity moves to 18 au (see Fig. 6b), whereas at t=0.80 Myr it merges with the inner bump at 30 au (see Fig. 6c).
The bumps can also be sites for dust trapping and planetesimal formation. Consequently, the total planetesimal mass increases from 31.4 M⊕ to 33.9 M⊕. Meanwhile, ∼7.6 M⊕ mass of planetesimals form in the bumps, leading to a slight reduction in the planetesimal mass formed at the outer edge of the photoevaporative cavity, from ∼30.5 M⊕ to ∼26.3 M⊕. We also note that as the photoevaporative cavity expands progressively outward, it merges with the existing bumps.
We compute the optical depth τv following:
 (34)
where
(34)
where  and
and  are the absorption and effective scattering opacities of dust species i, and
  is the dust surface density of dust species i. The values of
  and gv, i are adopted from the DSHARP opacity model (Birnstiel et al. 2018). The optical depth (838 μm) at the edge of photoevaporative cavity is ∼2.1 at t=0.60 Myr (see Fig. A.1). The τv values of the three bumps are approximately in the ratio of 4:2.4:1, whereas the corresponding dust surface density ratios are 3:2:1. The relatively high optical depth at the cavity edge arises not only from the larger dust surface density but also from the preferential removal of small particles by photoevaporation, which increases the fraction of particles larger than 1 mm. Since such large particles have higher opacities at the observation wavelength, the resulting τν becomes significantly enhanced in this region.
Gárate et al. (2023) also studies the combined impact of early substructures and photoevaporation. They find that in disks with primordial substructures, once photoevaporation opens an inner cavity, further dust loss due to radial drift is largely prevented, and dust removal by wind entrainment has only a minor effect on the evolution of solids. Such disks can retain a substantial dust mass. The difference between their work and ours is that they do not include the planetesimal formation. Furthermore, they indicate that the ratio of the gap location relative to the disk’s characteristic radius r/Rc controls how much dust can be retained.
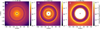 |
Fig. 6 Synthetic dust continuum images at 880 μm for three evolutionary stages of the protoplanetary disk model with three local pressure bumps at 30 au and 60 au in Sect. 4.3. Panel a: t=0.38 Myr, pre-cavity stage; Panel b: t=0.60 Myr, post-cavity stage when the photoevaporative cavity moves to 18 au; Panel c: t=0.80 Myr, when the photoevaporative cavity merges with the inner bump at 30 au. The blanks within the inner disks in Panels b) and c) correspond to the photoevaporative cavities. |
4.4 Caveats
We point out several limitations in our study. First, we neglect the interaction of dust onto gas, commonly referred to as dust-to-gas backreaction, in all of our simulations. This effect can be pronounced when the solid density approaches that of the surrounding gas (ε=ρd/ρg ∼1). From the classical SI perspective, the drag force exerted by dust particles accelerates the gas’s azimuthal motion. This, in turn, suppresses the inward drift of solids and further increases the local dust-to-gas ratio, making planetesimal formation more favorable.
Nevertheless, near the pressure maximum of the photoevaporation cavity, this backreaction plays a dual role: whereas it slows down the drift of dust, the gas simultaneously gains angular momentum, which acts to widen the pressure bump. This broadening would, on the other hand, limit the further dust concentration. Consequently, the overall impact of backreaction on the SI and planetesimal formation can be more complicated. We also conducted an additional simulation based on run_fid that included the dust-to-gas backreaction, implemented through the DustPyLib interface (Stammler et al. 2023). The result is overall similar in terms of final planetesimal mass, which decreases from 31.4 M⊕ to 30.7 M⊕.
The other limitation is not accounting for the effect of the ice line. Our model employs a static disk temperature profile and therefore does not account for the movement of the ice lines. Furthermore, we do not consider composition-dependent sublimation as pebbles drift across the ice lines of various species. The process of sublimation, followed by diffusion and recondensation, could locally enhance the solid abundance near the ice line location (Ida & Guillot 2016; Drążkowska & Alibert 2017; Schoonenberg & Ormel 2017). Consequently, the omission of the above mechanisms likely leads to an underestimation of planetesimal formation near ice lines. Future models should incorporate an evolving disk thermal structure and track the compositional evolution of pebbles to properly model the influence of ice lines.
Here we also do not consider the bouncing barrier. Laboratory and numerical studies indicate that the bouncing barrier typically prevents further coagulation once the dust aggregates reach millimeter-centimeter size (Zsom et al. 2010). Neglecting this effect may therefore overestimate the mass fraction of pebbles that can grow to the sizes relevant for triggering the SI.
Finally, we note that turbulence plays a more complex role in realistic disk environments than that assumed in Lim et al. (2024). Large-scale structures developed from magnetorotational or hydrodynamic instabilities can create local pressure maxima that efficiently trap solids and promote planetesimal formation. In particular, Eriksson et al. (2025) finds that vortices can efficiently trap drifting dust at their pressure maxima, leading to locally enhanced dust-to-gas ratios. The weak turbulence and low relative velocities within the central regions of vortices facilitate particle growth, and once planetesimals form, they can continue to grow through efficient pebble accretion. Likewise, Carrera et al. (2025) identifies a positive feedback between dust coagulation and the SI, where enhanced dust concentration reduces turbulence and drift, promoting further particle growth and a stronger SI. Moreover, Huang & Bai (2025) demonstrates that the interplay among the VSI and the SI can produce strong dust clumping within vortices in the outer disk regions even at moderately low dust-to-gas ratios. These effects are not considered in our current work.
5 Conclusions
In this work, we employed the DustPy code to study the dust coagulation, fragmentation, and radial drift, in a viscously accreting protoplanetary disk subject to stellar X-ray photoevaporation. Photoevaporation opens an inner cavity at orbital radii of a few au, causing the disk’s inner edge to expand radially outward as gas disperses. This process efficiently removes gas via photoevaporative winds and therefore largely enhances the local dust-to-gas ratio at the pressure bump near the cavity’s edge, which serves as a natural site to trigger the SI. We demonstrate that planetesimal formation via the SI, driven by the stellar X-ray photoevaporation, is robust during the disk dispersal phase. In our fiducial model, in total 31.4 M⊕ of planetesimals form within the 100 au disk region. Furthermore, the exact choice of the SI criteria has little impact on the results.
We explore how the key physical processes regulate both the onset of the SI and the final masses of planetesimals. We find that the efficiency of SI-induced planetesimal formation is strongly regulated by the available dust reservoir and its retention during disk evolution. Higher metallicity retains dust mass more effectively, directly enhancing planetesimal formation. Higher viscosity induces faster gas replenishment from the outer disk region, delays cavity opening, reduces the overall dust reservoir, and thus hinders planetesimal formation. Higher stellar X-ray luminosity promotes earlier photoevaporative cavity opening while preserving dust at the cavity edge, thereby favoring planetesimal formation. Larger disks prolong dust retention, thereby extending the duration of planetesimal formation. By retaining dust more efficiently, substructured disks create favorable conditions for planetesimal formation. To summarize, our models suggest that planetesimal formation is favored in disks with larger sizes, substructures, higher metallicities, lower viscosities, higher dust fragmentation threshold velocities, and/or around stars with higher X-ray luminosities. Future work will focus on the growth and migration of these forming planetesimals (Fang et al. 2023; Lau et al. 2022, 2024, 2025) starting from a realistic birth mass distribution (Schäfer et al. 2017; Liu et al. 2020).
Acknowledgements
We thank the anonymous referee for constructive feedback on the manuscript. This work is supported by the National Key R&D Program of China (2024YFA1611803). B.L. acknowledges support from the startup grant of the Bairen program from Zhejiang University. HY is supported by the National Natural Science Foundation of China (Grant No. 12473067). J.D. is funded by the European Union under the European Union’s Horizon Europe Research & Innovation Program 101040037 (PLANETOIDS).
References
- Alexander, R., Pascucci, I., Andrews, S., Armitage, P., & Cieza, L., 2014, Protostars and Planets VI, 475 [Google Scholar]
- Andrews, S. M., 2020, ARAA, 58, 483 [NASA ADS] [CrossRef] [Google Scholar]
- Bai, X.-N., 2014, ApJ, 791, 137 [Google Scholar]
- Bai, X.-N., & Stone, J. M., 2010, ApJ, 722, 1437 [NASA ADS] [CrossRef] [Google Scholar]
- Batalha, N. M., Rowe, J. F., Bryson, S. T., et al. 2013, ApJS, 204, 24 [Google Scholar]
- Birnstiel, T., Ormel, C., & Dullemond, C., 2011, A&A, 525, A11 [NASA ADS] [CrossRef] [EDP Sciences] [Google Scholar]
- Birnstiel, T., Klahr, H., & Ercolano, B., 2012, A&A, 539, A148 [NASA ADS] [CrossRef] [EDP Sciences] [Google Scholar]
- Birnstiel, T., Fang, M., & Johansen, A., 2016, Space Sci. Rev., 205, 41 [Google Scholar]
- Birnstiel, T., Dullemond, C. P., Zhu, Z., et al. 2018, ApJ, 869, L45 [CrossRef] [Google Scholar]
- Bitsch, B., Lambrechts, M., & Johansen, A., 2015, A&A, 582, A112 [NASA ADS] [CrossRef] [EDP Sciences] [Google Scholar]
- Blum, J., & Münch, M., 1993, Icarus, 106, 151 [Google Scholar]
- Blum, J., & Wurm, G., 2000, Icarus, 143, 138 [NASA ADS] [CrossRef] [Google Scholar]
- Blum, J., & Wurm, G., 2008, ARAA, 46, 21 [Google Scholar]
- Booth, R. A., & Clarke, C. J., 2021, MNRAS, 502, 1569 [NASA ADS] [CrossRef] [Google Scholar]
- Brauer, F., Dullemond, C., & Henning, T., 2008, A&A, 480, 859 [NASA ADS] [CrossRef] [EDP Sciences] [Google Scholar]
- Burn, R., Emsenhuber, A., Weder, J., et al. 2022, A&A, 666, A73 [NASA ADS] [CrossRef] [EDP Sciences] [Google Scholar]
- Carrera, D., Johansen, A., & Davies, M. B., 2015, A&A, 579, A43 [NASA ADS] [CrossRef] [EDP Sciences] [Google Scholar]
- Carrera, D., Gorti, U., Johansen, A., & Davies, M. B., 2017, ApJ, 839, 16 [Google Scholar]
- Carrera, D., Lim, J., Eriksson, L. E., Lyra, W., & Simon, J. B., 2025, A&A, 696, L23 [NASA ADS] [CrossRef] [EDP Sciences] [Google Scholar]
- Cassan, A., Kubas, D., Beaulieu, J.-P., et al. 2012, Nature, 481, 167 [NASA ADS] [CrossRef] [Google Scholar]
- Clarke, C., & Pringle, J., 1988, MNRAS, 235, 365 [NASA ADS] [CrossRef] [Google Scholar]
- Dittrich, K., Klahr, H., & Johansen, A., 2013, ApJ, 763, 117 [NASA ADS] [CrossRef] [Google Scholar]
- Dominik, C., & Tielens, A., 1997, ApJ, 480, 647 [NASA ADS] [CrossRef] [Google Scholar]
- Drążkowska, J., & Alibert, Y., 2017, A&A, 608, A92 [Google Scholar]
- Drążkowska, J., Windmark, F., & Dullemond, C. P., 2014, A&A, 567, A38 [NASA ADS] [CrossRef] [EDP Sciences] [Google Scholar]
- Drążkowska, J., Alibert, Y., & Moore, B., 2016, A&A, 594, A105 [Google Scholar]
- Drążkowska, J., Bitsch, B., Lambrechts, M., et al. 2023, Protostars and Planets VII, 534, 717 [Google Scholar]
- Dubrulle, B., Morfill, G., & Sterzik, M., 1995, Icarus, 114, 237 [Google Scholar]
- Dullemond, C. P., Birnstiel, T., Huang, J., et al. 2018, ApJ, 869, L46 [NASA ADS] [CrossRef] [Google Scholar]
- Dzyurkevich, N., Flock, M., Turner, N. J., Klahr, H., & Henning, T., 2010, A&A, 515, A70 [NASA ADS] [CrossRef] [EDP Sciences] [Google Scholar]
- Emsenhuber, A., Mordasini, C., Burn, R., et al. 2021, A&A, 656, A69 [NASA ADS] [CrossRef] [EDP Sciences] [Google Scholar]
- Ercolano, B., & Pascucci, I., 2017, Roy. Soc. Open Sci., 4, 170114 [Google Scholar]
- Ercolano, B., Jennings, J., Rosotti, G., & Birnstiel, T., 2017, MNRAS, 472, 4117 [NASA ADS] [CrossRef] [Google Scholar]
- Eriksson, L. E., Johansen, A., & Liu, B., 2020, A&A, 635, A110 [NASA ADS] [CrossRef] [EDP Sciences] [Google Scholar]
- Eriksson, L. E. J., Menon, S., Carrera, D., Lyra, W., & Burkhart, B., 2025, MNRAS, 542, 641 [Google Scholar]
- Facchini, S., Clarke, C. J., & Bisbas, T. G., 2016, MNRAS, 457, 3593 [NASA ADS] [CrossRef] [Google Scholar]
- Fang, T., Zhang, H., Liu, S., Liu, B., & Deng, H., 2023, ApJ, 948, 98 [Google Scholar]
- Gárate, M., Delage, T. N., Stadler, J., et al. 2021, A&A, 655, A18 [NASA ADS] [CrossRef] [EDP Sciences] [Google Scholar]
- Gárate, M., Birnstiel, T., Pinilla, P., et al. 2023, A&A, 679, A15 [NASA ADS] [CrossRef] [EDP Sciences] [Google Scholar]
- Gonzalez, J.-F., Laibe, G., Maddison, S., Pinte, C., & Ménard, F., 2015, Planet. Space Sci., 116, 48 [NASA ADS] [CrossRef] [Google Scholar]
- Gorti, U., Hollenbach, D., & Dullemond, C., 2015, ApJ, 804, 29 [NASA ADS] [CrossRef] [Google Scholar]
- Güttler, C., Blum, J., Zsom, A., Ormel, C. W., & Dullemond, C. P., 2010, A&A, 513, A56 [Google Scholar]
- Huang, J., Andrews, S. M., Dullemond, C. P., et al. 2018, ApJ, 869, L42 [NASA ADS] [CrossRef] [Google Scholar]
- Huang, P., & Bai, X.-N., 2025, ApJ, 986, L13 [Google Scholar]
- Ida, S., & Lin, D. N., 2004, ApJ, 604, 388 [NASA ADS] [CrossRef] [Google Scholar]
- Ida, S., & Guillot, T., 2016, A&A, 596, L3 [EDP Sciences] [Google Scholar]
- Jennings, J., Ercolano, B., & Rosotti, G. P., 2018, MNRAS, 477, 4131 [Google Scholar]
- Johansen, A., & Klahr, H., 2005, ApJ, 634, 1353 [NASA ADS] [CrossRef] [Google Scholar]
- Johansen, A., Oishi, J. S., Low, M.-M. M., et al. 2007, Nature, 448, 1022 [NASA ADS] [CrossRef] [Google Scholar]
- Johansen, A., Youdin, A., & Klahr, H. 2009a, ApJ, 697, 1269 [Google Scholar]
- Johansen, A., Youdin, A., & Mac Low, M.-M. 2009b, ApJ, 704, L75 [NASA ADS] [CrossRef] [Google Scholar]
- Johansen, A., Blum, J., Tanaka, H., et al. 2014, Protostars and Planets VI, 547 [Google Scholar]
- Kataoka, A., Tanaka, H., Okuzumi, S., & Wada, K., 2013, A&A, 557, L4 [NASA ADS] [CrossRef] [EDP Sciences] [Google Scholar]
- Kobayashi, H., Ormel, C., & Ida, S., 2012, in Division for Planetary Sciences, 44, 415 [Google Scholar]
- Lau, T. C. H., Drążkowska, J., Stammler, S. M., Birnstiel, T., & Dullemond, C. P., 2022, A&A, 668, A170 [NASA ADS] [CrossRef] [EDP Sciences] [Google Scholar]
- Lau, T. C. H., Birnstiel, T., Drążkowska, J., & Stammler, S. M., 2024, A&A, 688, A22 [NASA ADS] [CrossRef] [EDP Sciences] [Google Scholar]
- Lau, T. C. H., Birnstiel, T., Stammler, S. M., & Drążkowska, J., 2025, ApJ, 994, 74 [Google Scholar]
- Lehmann, M., & Lin, M.-K., 2025, ApJ, 983, 135 [Google Scholar]
- Li, R., & Youdin, A. N., 2021, ApJ, 919, 107 [NASA ADS] [CrossRef] [Google Scholar]
- Lim, J., Simon, J. B., Li, R., et al. 2024, ApJ, 969, 130 [NASA ADS] [CrossRef] [Google Scholar]
- Lim, J., Simon, J. B., Li, R., et al. 2025a, arXiv preprint [arXiv:2509.18270] [Google Scholar]
- Lim, J., Simon, J. B., Li, R., et al. 2025b, ApJ, 981, 160 [Google Scholar]
- Lissauer, J. J., 1993, ARAA, 31, 129 [NASA ADS] [CrossRef] [Google Scholar]
- Liu, B., & Ji, J., 2020, RAA, 20, 164 [Google Scholar]
- Liu, B., Lambrechts, M., Johansen, A., & Liu, F., 2019, A&A, 632, A7 [NASA ADS] [CrossRef] [EDP Sciences] [Google Scholar]
- Liu, B., Lambrechts, M., Johansen, A., Pascucci, I., & Henning, T., 2020, A&A, 638, A88 [EDP Sciences] [Google Scholar]
- Liu, B., Baruteau, C., Zhu, Z., Li, Y.-P., & Paardekooper, S.-J. 2025, A&A, 702, A142 [NASA ADS] [CrossRef] [EDP Sciences] [Google Scholar]
- Lynden-Bell, D., & Pringle, J. E., 1974, MNRAS, 168, 603 [Google Scholar]
- Lyra, W., Johansen, A., Zsom, A., Klahr, H., & Piskunov, N., 2009, A&A, 497, 869 [NASA ADS] [CrossRef] [EDP Sciences] [Google Scholar]
- Miller, E., Marino, S., Stammler, S., et al. 2021, MNRAS, 508, 5638 [NASA ADS] [CrossRef] [Google Scholar]
- Mordasini, C., Alibert, Y., Klahr, H., & Henning, T., 2012, A&A, 547, A111 [NASA ADS] [CrossRef] [EDP Sciences] [Google Scholar]
- Mulders, G. D., Pascucci, I., Apai, D., & Ciesla, F. J., 2018, AJ, 156, 24 [Google Scholar]
- Nakagawa, Y., Sekiya, M., & Hayashi, C., 1986, Icarus, 67, 375 [Google Scholar]
- Nelson, R. P., Gressel, O., & Umurhan, O. M., 2013, MNRAS, 435, 2610 [Google Scholar]
- Okuzumi, S., Tanaka, H., Kobayashi, H., & Wada, K., 2012, ApJ, 752, 106 [NASA ADS] [CrossRef] [Google Scholar]
- Ormel, C., & Cuzzi, J., 2007, A&A, 466, 413 [NASA ADS] [CrossRef] [EDP Sciences] [Google Scholar]
- Owen, J., Ercolano, B., Clarke, C., & Alexander, R., 2010, MNRAS, 401, 1415 [NASA ADS] [CrossRef] [Google Scholar]
- Owen, J. E., Clarke, C. J., & Ercolano, B., 2012, MNRAS, 422, 1880 [Google Scholar]
- Pan, M., Liu, B., Jiang, L., et al. 2025, ApJ, 985, 7 [Google Scholar]
- Picogna, G., Ercolano, B., Owen, J. E., & Weber, M. L., 2019, MNRAS, 487, 691 [Google Scholar]
- Pinilla, P., Birnstiel, T., Ricci, L., et al. 2012, A&A, 538, A114 [NASA ADS] [CrossRef] [EDP Sciences] [Google Scholar]
- Pinilla, P., Tazzari, M., Pascucci, I., et al. 2018, ApJ, 859, 32 [Google Scholar]
- Pollack, J. B., Hubickyj, O., Bodenheimer, P., et al. 1996, Icarus, 124, 62 [NASA ADS] [CrossRef] [Google Scholar]
- Preibisch, T., Kim, Y.-C., Favata, F., et al. 2005, ApJS, 160, 401 [NASA ADS] [CrossRef] [Google Scholar]
- Raettig, N., Klahr, H., & Lyra, W., 2015, ApJ, 804, 35 [Google Scholar]
- Safronov, V. S., 1972, in Evolution of the Protoplanetary Cloud and Formation of the Earth and the Planets, ed. V. S. Safronov (Moscow: Nauka), Transl. 1972 NASA Tech. F-677 [Google Scholar]
- Schäfer, U., Yang, C.-C., & Johansen, A., 2017, A&A, 597, A69 [Google Scholar]
- Schoonenberg, D., & Ormel, C. W., 2017, A&A, 602, A21 [NASA ADS] [CrossRef] [EDP Sciences] [Google Scholar]
- Schoonenberg, D., Ormel, C. W., & Krijt, S., 2018, A&A, 620, A134 [NASA ADS] [CrossRef] [EDP Sciences] [Google Scholar]
- Sekiya, M., & Onishi, I. K., 2018, ApJ, 860, 140 [Google Scholar]
- Sellek, A. D., Booth, R. A., & Clarke, C. J., 2020, MNRAS, 492, 1279 [NASA ADS] [CrossRef] [Google Scholar]
- Sellek, A. D., Grassi, T., Picogna, G., et al. 2024, A&A, 690, A296 [NASA ADS] [CrossRef] [EDP Sciences] [Google Scholar]
- Shakura, N. I., & Sunyaev, R. A., 1973, A&A, 24, 337 [NASA ADS] [Google Scholar]
- Simon, J. B., Armitage, P. J., Li, R., & Youdin, A. N., 2016, ApJ, 822, 55 [Google Scholar]
- Smoluchowski, M. v. 1916, Z. Phys., 17, 557 [NASA ADS] [Google Scholar]
- Stammler, S. M., & Birnstiel, T., 2022, ApJ, 935, 35 [NASA ADS] [CrossRef] [Google Scholar]
- Stammler, S. M., Drżkowska, J., Birnstiel, T., et al. 2019, ApJ, 884, L5 [NASA ADS] [CrossRef] [Google Scholar]
- Stammler, S. M., Birnstiel, T., & Gárate, M., 2023, Astrophysics Source Code Library [record ascl:2310.005] [Google Scholar]
- Throop, H. B., & Bally, J., 2005, ApJ, 623, L149 [NASA ADS] [CrossRef] [Google Scholar]
- Varnière, P., & Tagger, M., 2006, A&A, 446, L13 [NASA ADS] [CrossRef] [EDP Sciences] [Google Scholar]
- Wang, L., & Goodman, J. J., 2017, ApJ, 835, 59 [Google Scholar]
- Weidenschilling, S., 1977, MNRAS, 180, 57 [NASA ADS] [CrossRef] [Google Scholar]
- Weidenschilling, S., 1980, Icarus, 44, 172 [NASA ADS] [CrossRef] [Google Scholar]
- Whipple, F. L., 1972, in From Plasma to Planet, 211 [Google Scholar]
- Whipple, F. L., 1973, NASA, Washington Evolutionary and Phys. Properties of Meteoroids [Google Scholar]
- Xu, Z., & Bai, X.-N. 2022, ApJ, 937, L4 [Google Scholar]
- Yang, C.-C., Johansen, A., & Carrera, D., 2017, A&A, 606, A80 [NASA ADS] [CrossRef] [EDP Sciences] [Google Scholar]
- Yang, C.-C., Mac Low, M.-M., & Johansen, A., 2018, ApJ, 868, 27 [NASA ADS] [CrossRef] [Google Scholar]
- Youdin, A. N., & Goodman, J., 2005, ApJ, 620, 459 [Google Scholar]
- Youdin, A. N., & Lithwick, Y., 2007, Icarus, 192, 588 [NASA ADS] [CrossRef] [Google Scholar]
- Zhao, H., Lau, T. C. H., Birnstiel, T., Stammler, S. M., & Draz̧kowska, J., 2025, A&A, 694, A205 [NASA ADS] [CrossRef] [EDP Sciences] [Google Scholar]
- Zhou, T., Deng, H.-P., Chen, Y.-X., & Lin, D. N. C., 2022, ApJ, 940, 117 [Google Scholar]
- Zhu, W., & Dong, S., 2021, ARAA, 59, 291 [NASA ADS] [CrossRef] [Google Scholar]
- Zhu, Z., & Yang, C.-C., 2021, MNRAS, 501, 467 [Google Scholar]
- Zhu, Z., Nelson, R. P., Dong, R., Espaillat, C., & Hartmann, L., 2012, ApJ, 755, 6 [Google Scholar]
- Zsom, A., Ormel, C. W., Güttler, C., Blum, J., & Dullemond, C., 2010, A&A, 513, A57 [NASA ADS] [CrossRef] [EDP Sciences] [Google Scholar]
Appendix A Optical depth
We compute the optical depth τν following:
 (A.1)
where
(A.1)
where  and
and  are the absorption and effective scattering opacities of dust species i, and
  is the dust surface density of dust species i. The values of
  and gv,i are adopted from the DSHARP opacity model (Birnstiel et al. 2018).
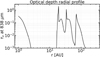 |
Fig. A.1 Radial profiles of the optical depth τv at 838 μm for the three pressure bumps at t=0.60 Myr. |
The optical depth (838 μm) at the edge of photoevaporative cavity is ∼2.1 at t=0.60 Myr. The τv values of the other two bumps are approximately ∼1.2 at ∼34 au and ∼0.5 at ∼70 au. The optical depth of the outer bump at ∼70 au is consistent with the results reported by Dullemond et al. (2018), who shows that observed outer disk rings typically have optical depths of order ∼0.5. Stammler et al. (2019) attributes these moderate optical depths to ongoing planetesimal formation, in agreement with our findings. In contrast, our results indicate significantly higher optical depths at the photoevaporative cavity edge and in the inner bump.
Appendix B Dust entrainment
In this work, we adopt the dust entrainment model of Sellek et al. (2020) as our fiducial prescription for dust removal by photoevaporation. However, subsequent studies by Booth & Clarke (2021) and Burn et al. (2022) suggest that the entrained dust size may be significantly smaller, motivating an alternative dust entrainment model driven by internal photoevaporation:
 (B.1)
where Hbase ≃Hg denotes the gas scale height at the wind base, and zbase is the height at which the photoevaporative wind is launched. We adopt zbase/Hbase=4 as suggested by Booth & Clarke (2021). The maximum entrained size aent,int is limited to only a few microns.
(B.1)
where Hbase ≃Hg denotes the gas scale height at the wind base, and zbase is the height at which the photoevaporative wind is launched. We adopt zbase/Hbase=4 as suggested by Booth & Clarke (2021). The maximum entrained size aent,int is limited to only a few microns.
To assess the impact of these different assumptions, we performed a set of comparative simulations using three models: the fiducial model (FID), the pure gas photoevaporation model (PG), and the dust entrainment model driven by internal photoevaporation (IDE).
Fig. B.1 a compares the final planetesimal mass obtained at the end of the simulations, whereas Fig. B.1b shows the time evolution of the total planetesimal mass Mplt for the three models.
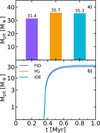 |
Fig. B.1 Panel a) Total planetesimal mass Mplt for three models FID (purple), PG (orange), and IDE (cyan). Panel b) Time evolution of the planetesimal mass Mplt for three models. |
We find that there is no significant difference between the PG and IDE models, either in the time evolution of Mplt or in the final planetesimal mass. This similarity arises because, in the IDE model, only dust particles with sizes of a few microns are efficiently entrained by the photoevaporative winds, leaving the bulk of dust mass largely unaffected. In contrast, the FID model, which allows the removal of larger dust particles, systematically underestimates the final planetesimal mass. We will improve the treatment of dust entrainment in future work.
All Tables
All Figures
|
Fig. 1 Time and radial distance evolution of different quantities in the fiducial model. Panel a: gas (dashed lines) and dust (solid lines) surface density. Panel b: Stokes number of the maximum-size dust particles (solid lines) and the mean Stokes number of the dust particles (dashed lines) at each radial bin. Maximum-size refers to the size of the particle whose surface density is at the peak of the mass bins hereafter. Panel c: midplane density ratio ε (solid lines) and metallicity Z (dashed lines). |
| In the text | |
|
Fig. 2 Synthetic 880 μm continuum images from the fiducial model. Panel a: t=0.25 Myr, pre-cavity stage; Panel b: t=0.35 Myr, onset of photoevaporative cavity opening; Panel c: t=0.45 Myr, post-cavity stage. |
| In the text | |
|
Fig. 3 Evolution of dust mass (black lines), planetesimal mass (red lines), and dust mass fraction within the pressure bump in three Stokes number bins (light blue for St<10−2, blue for 10−2 ≤ St ≤ 10−1, and deep blue for St>10−1), across four evolutionary stages: (i) pre-cavity, (ii) cavity at 10 au, (iii) cavity at 20 au, and (iv) cavity at 100 au. These panels show how initial conditions affect dust retention and planetesimal formation: Panel a: fiducial model (Z=0.01, LX=2.6 LX, ⊙, Mdisk=0.05 M⊙, Rc=60 au, α=10−4) serves as the baseline for comparison, showing balanced dust evolution and planetesimal production across the disk. Panel b: higher metallicity (Z=0.02) facilitates the retention of dust mass, thereby promoting planetesimal formation. Panel c: decreased X-ray luminosity (from 2.6 LX, ⊙ to 1.0 LX, ⊙) diminishes dust mass and consequently impedes planetesimal formation. Panel d: higher viscosity parameters (α=10−3, δt=10−4) induce gas replenishment from the outer disk, delay cavity opening, reduce the overall dust reservoir, and thus hinder planetesimal formation. Panel e: a more massive and extended disk (Mdisk=0.1 M⊙, Rc=120 au) prolongs dust retention, thereby extending the duration of planetesimal formation. Panel f: a less massive but extended disk (Mdisk=0.05 M⊙, Rc=120 au) lowers the inner-disk dust density, causing photoevaporation to open a cavity earlier. This makes more dust retained at the onset of photoevaporative cavity, which also provides more building blocks for planetesimal formation. |
| In the text | |
|
Fig. 4 Distribution of dust as a function of radial distance and particle size at t=0.30 Myr for run_fid (left) and run_frag (right). The color bar represents the surface density of dust per logarithmic mass interval. The green line is the drift limit (Eq. (14)), whereas the blue line is the fragmentation limit (Eq. (15)). The four white lines correspond to St=[10−3, 10−2, 10−1, 100]. |
| In the text | |
|
Fig. 5 Comparison of the radial mass distributions of planetesimals at different disk regions. The curves show the results for models with varying parameters: run_fid (black), run_metal (blue), run_lumi (orange), run_alpha (purple), run_dsize1 (red), and run_dsize2 (cyan). |
| In the text | |
|
Fig. 6 Synthetic dust continuum images at 880 μm for three evolutionary stages of the protoplanetary disk model with three local pressure bumps at 30 au and 60 au in Sect. 4.3. Panel a: t=0.38 Myr, pre-cavity stage; Panel b: t=0.60 Myr, post-cavity stage when the photoevaporative cavity moves to 18 au; Panel c: t=0.80 Myr, when the photoevaporative cavity merges with the inner bump at 30 au. The blanks within the inner disks in Panels b) and c) correspond to the photoevaporative cavities. |
| In the text | |
|
Fig. A.1 Radial profiles of the optical depth τv at 838 μm for the three pressure bumps at t=0.60 Myr. |
| In the text | |
|
Fig. B.1 Panel a) Total planetesimal mass Mplt for three models FID (purple), PG (orange), and IDE (cyan). Panel b) Time evolution of the planetesimal mass Mplt for three models. |
| In the text | |
Current usage metrics show cumulative count of Article Views (full-text article views including HTML views, PDF and ePub downloads, according to the available data) and Abstracts Views on Vision4Press platform.
Data correspond to usage on the plateform after 2015. The current usage metrics is available 48-96 hours after online publication and is updated daily on week days.
Initial download of the metrics may take a while.