Fig. 1
Download original image
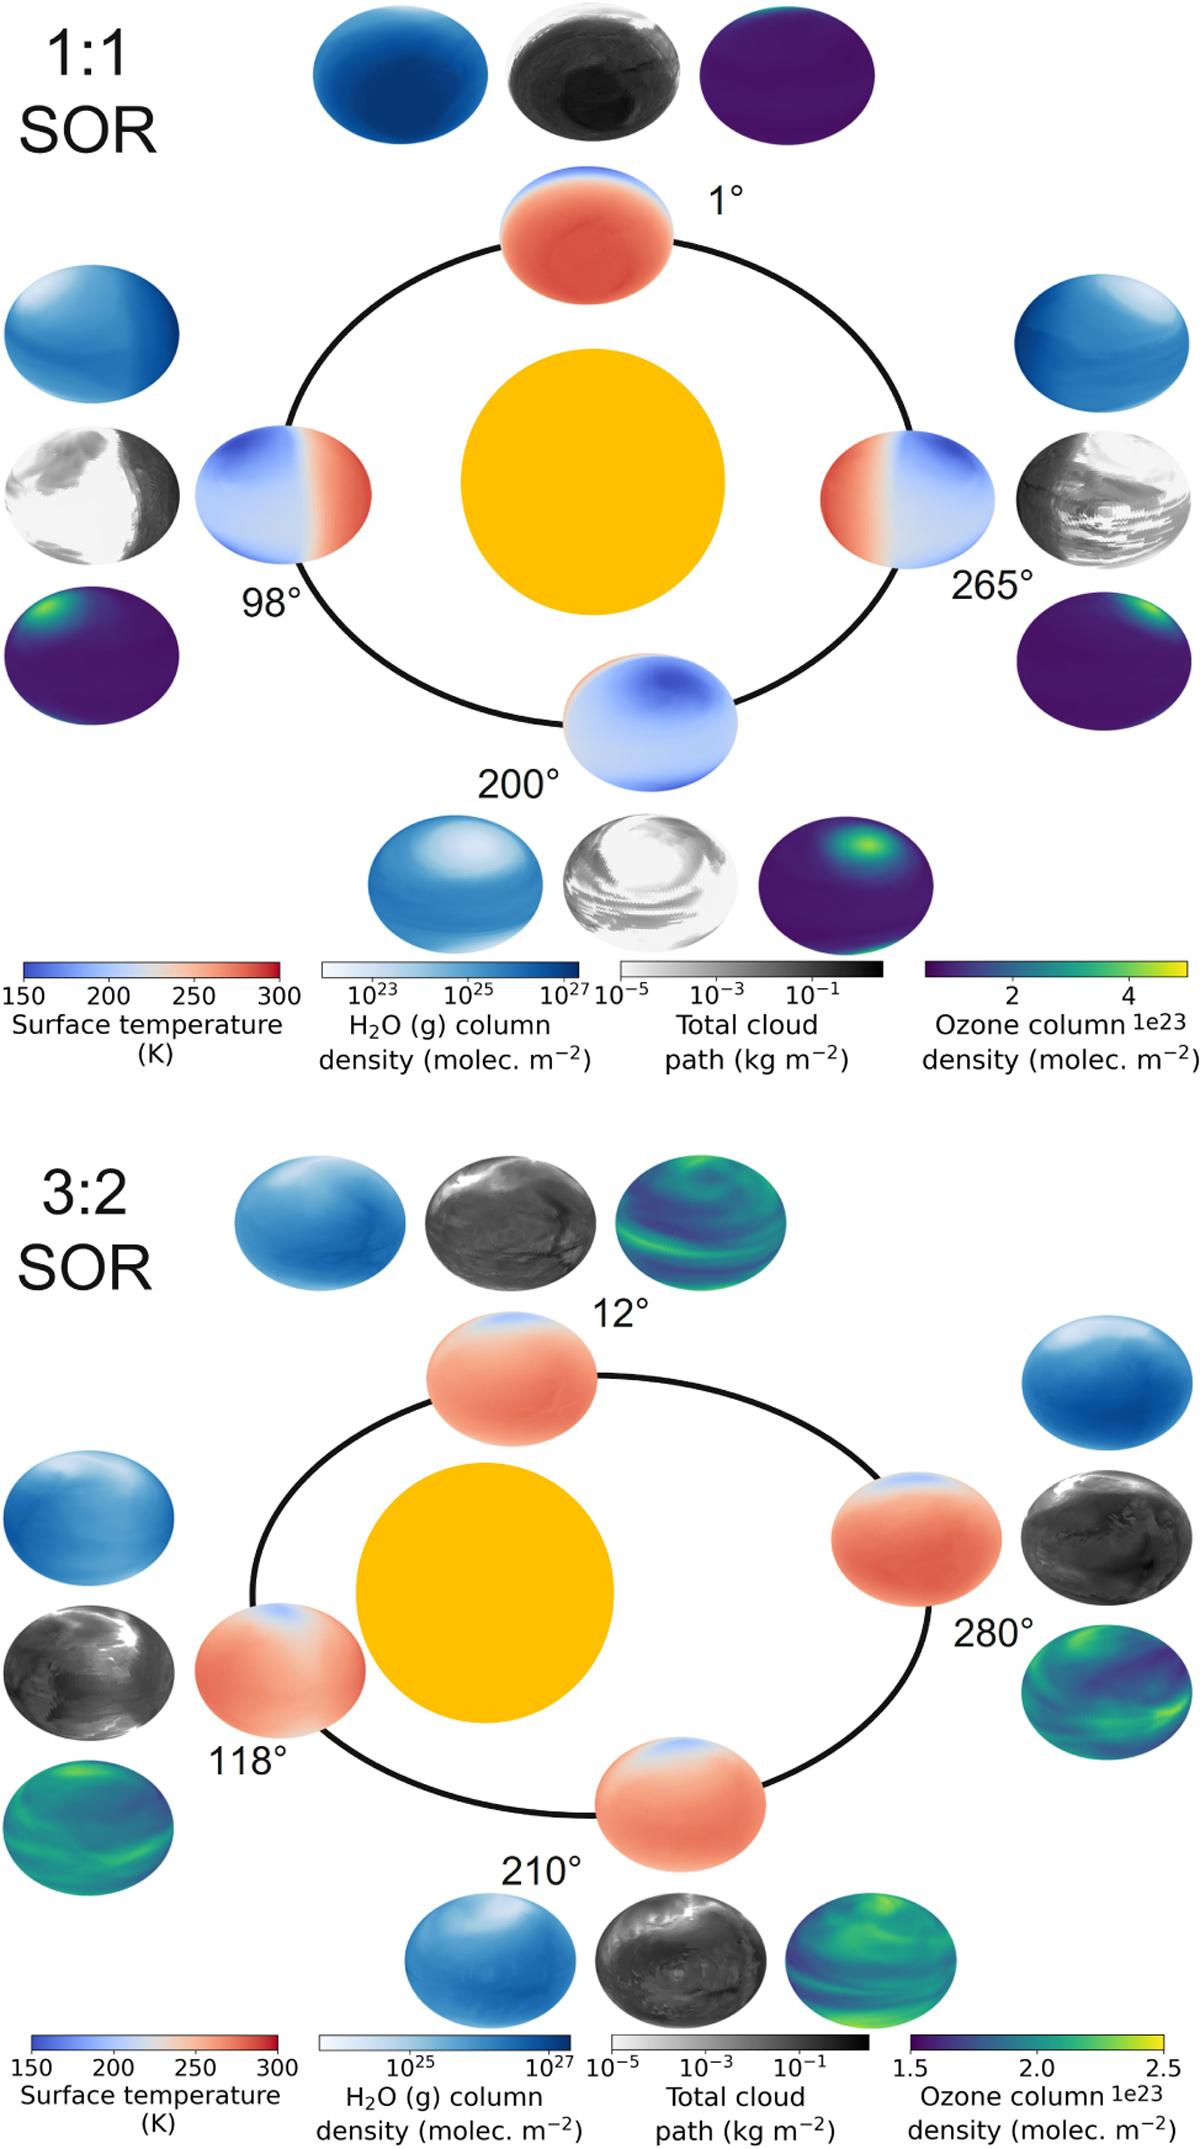
Observed hemispheric distributions as a function of θ(t) for the 1:1 SOR (top) and the 3:2 SOR with an eccentricity of 0.3 (bottom): surface temperature (blue-red), vertically integrated water vapour or H2O (g) column density (white–blue), vertically integrated total cloud path (white-grey), and vertically integrated O3 column density (dark blue– yellow). The longitude of perihelion of the 3:2 SOR is at 102.94◦. For both SORs, we use four extreme cases of θ(t) (see Table 1). The distributions vary spatially and temporally, illustrating the orbital evolution of climate and chemistry, as well as the effects of viewing geometry.
Current usage metrics show cumulative count of Article Views (full-text article views including HTML views, PDF and ePub downloads, according to the available data) and Abstracts Views on Vision4Press platform.
Data correspond to usage on the plateform after 2015. The current usage metrics is available 48-96 hours after online publication and is updated daily on week days.
Initial download of the metrics may take a while.