Fig. 3
Download original image
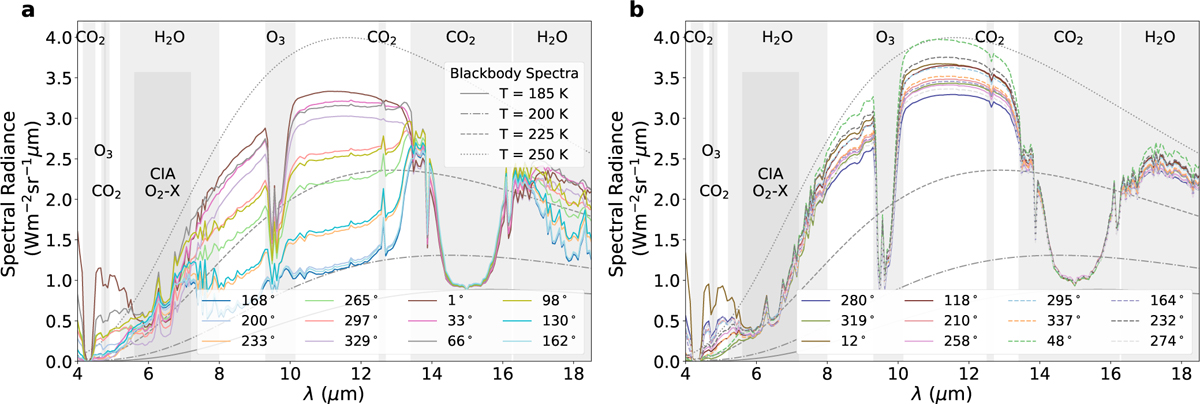
Simulated spectral radiance at the top of the atmosphere for Proxima Centauri b in (a) 1:1 SOR and (b) 3:2 SOR, for θ(t) as shown in Table 1. The spectra were created using PSG and the GlobES tool (see Sect. 2.2 for details). We also include blackbody curves at different temperatures for comparison and grey rectangles for important molecular and CIA features. For panel (b), the solid and dashed lines represent the first and second orbits around the host star, respectively, and together correspond to the length of a full day for the 3:2 SOR.
Current usage metrics show cumulative count of Article Views (full-text article views including HTML views, PDF and ePub downloads, according to the available data) and Abstracts Views on Vision4Press platform.
Data correspond to usage on the plateform after 2015. The current usage metrics is available 48-96 hours after online publication and is updated daily on week days.
Initial download of the metrics may take a while.