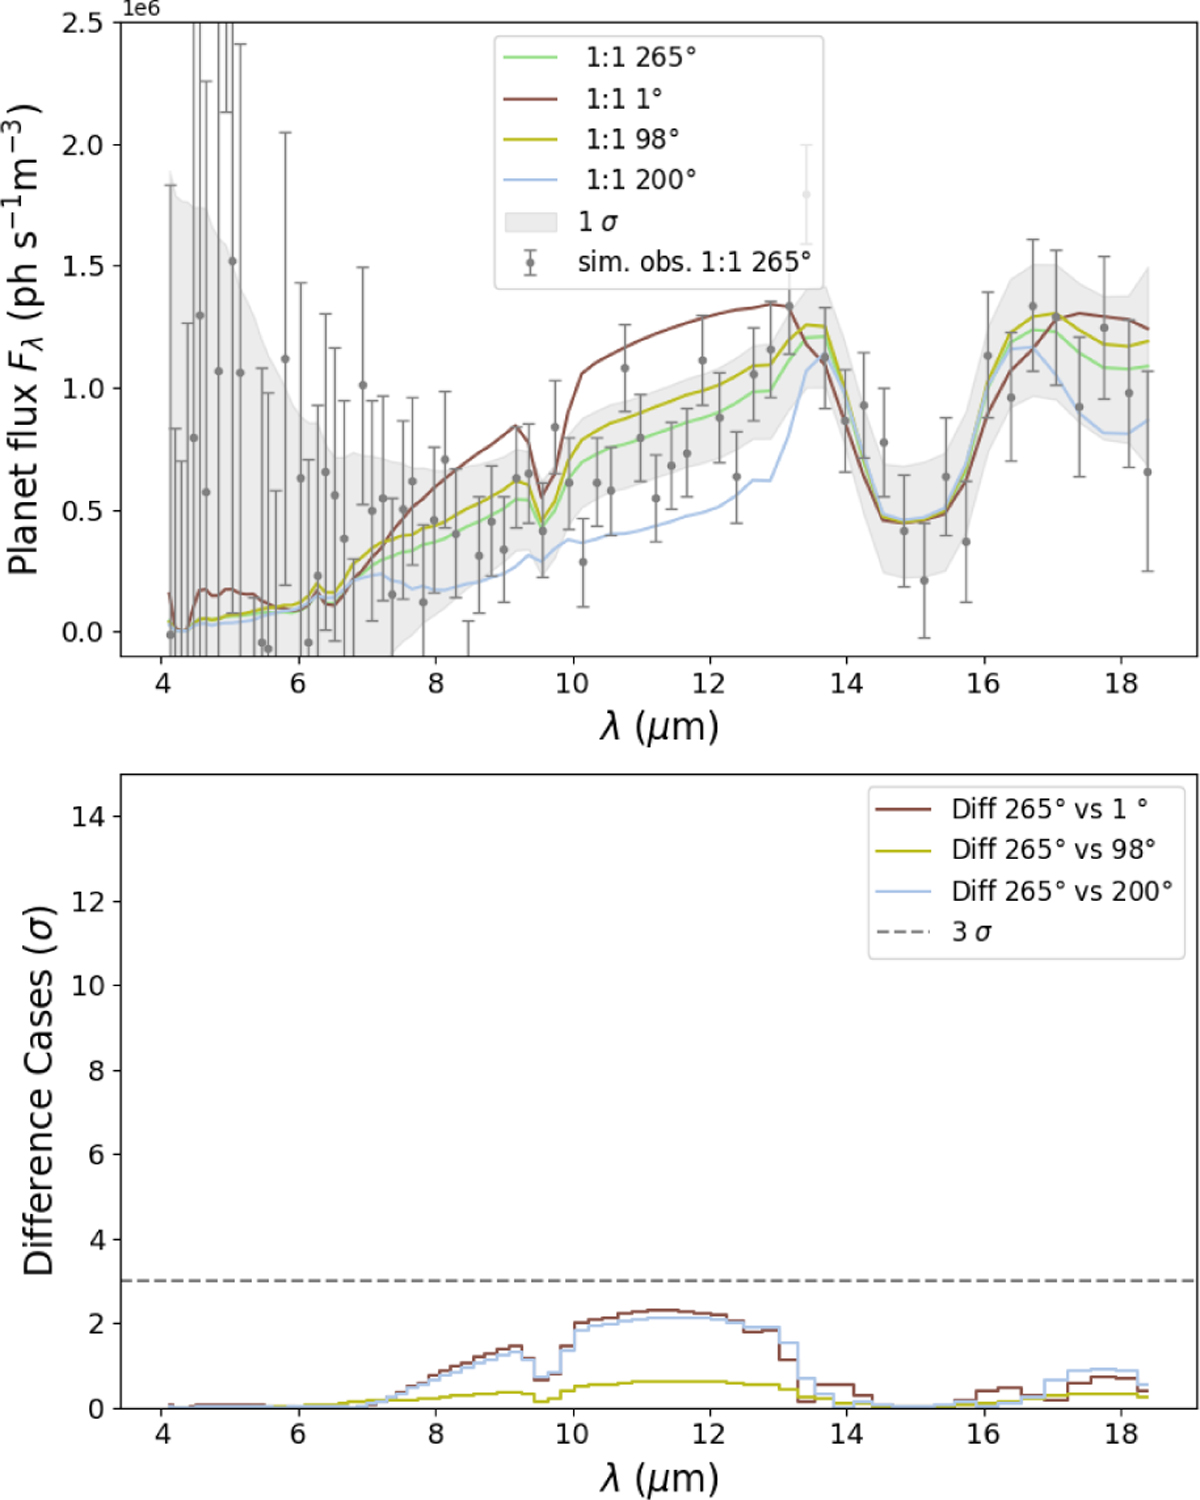
Fig. B.1
Download original image
Same as Fig. 4, but for an M3V system at 5 pcs and 4 days of observation time. We note that the scale on the flux axis is one order of magnitude smaller. The grey area represents the 1σ sensitivity; the dark grey error bars show an individual simulated observation. Lower panel: Statistical significance of the detected differences between different phases.
Current usage metrics show cumulative count of Article Views (full-text article views including HTML views, PDF and ePub downloads, according to the available data) and Abstracts Views on Vision4Press platform.
Data correspond to usage on the plateform after 2015. The current usage metrics is available 48-96 hours after online publication and is updated daily on week days.
Initial download of the metrics may take a while.