Open Access
Fig. 3
Download original image
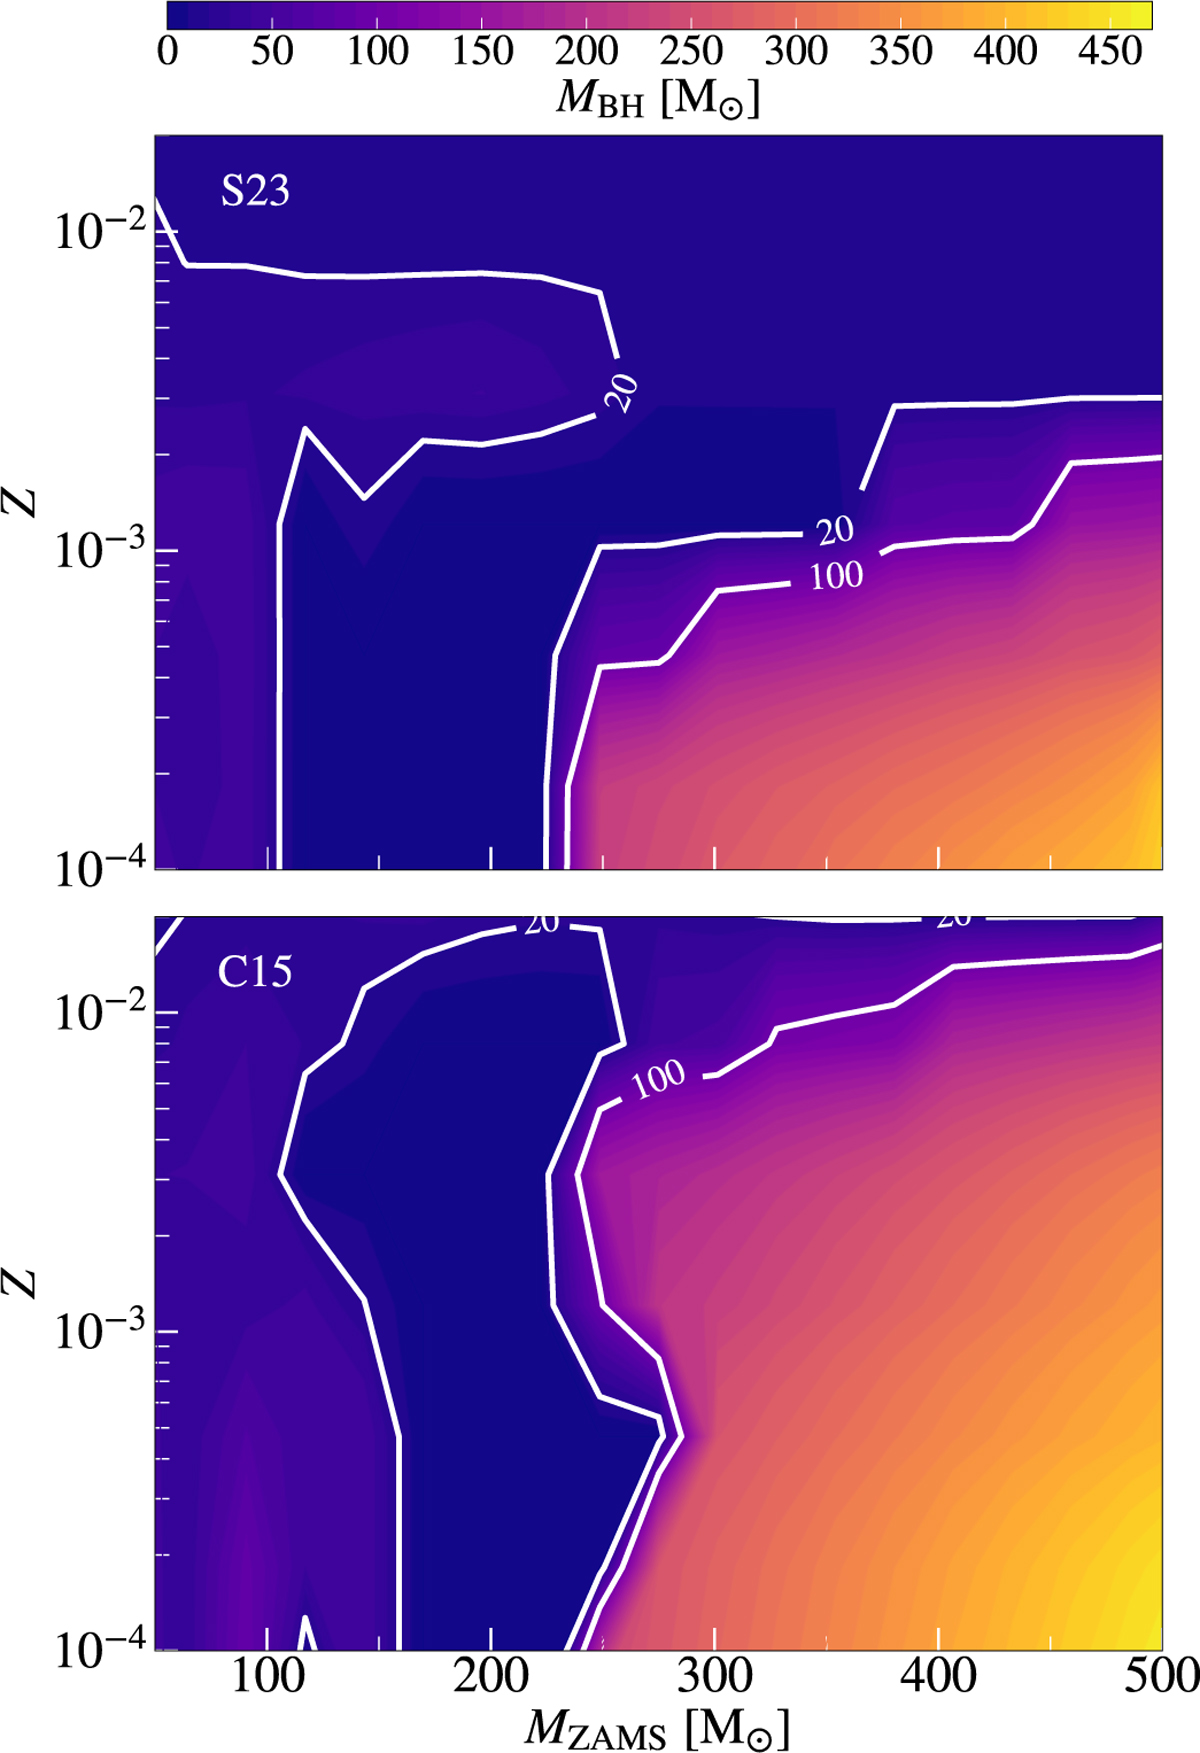
Contour plot showing the final BH mass as a function of MZAMS and Z, for the S23 (upper panel) and the C15 (lower panel) models. The white contours highlight the levels at 20 M⊙ and 100 M⊙.
Current usage metrics show cumulative count of Article Views (full-text article views including HTML views, PDF and ePub downloads, according to the available data) and Abstracts Views on Vision4Press platform.
Data correspond to usage on the plateform after 2015. The current usage metrics is available 48-96 hours after online publication and is updated daily on week days.
Initial download of the metrics may take a while.