Fig. 1
Download original image
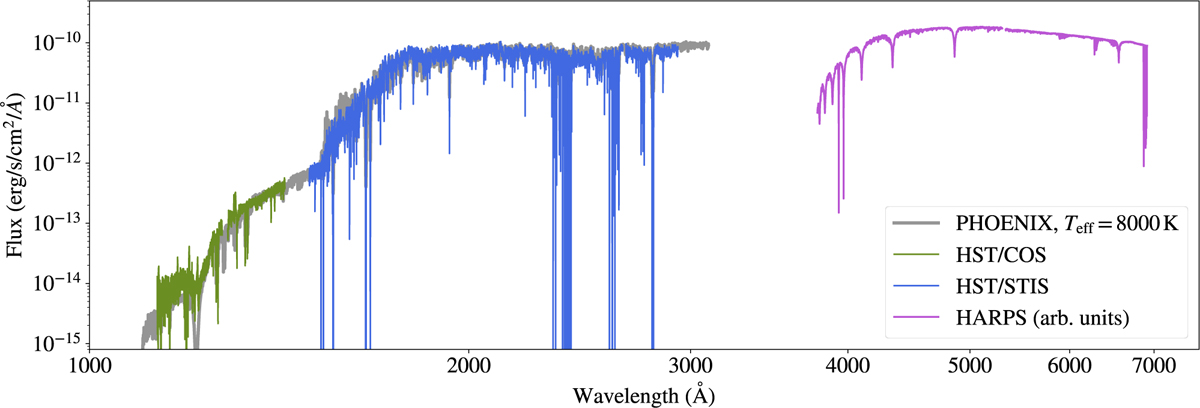
Spectroscopic observations of β Pic obtained on April 29, 2025. The HARPS spectrum is not flux-calibrated and was simply re-normalised to a flux level similar to that of the STIS data. Numerous saturated absorption lines are visible in the STIS and HARPS spectra, attributed to Si II, C I, Al II, Fe II, Mg II, and Ca II. The HST spectra are consistent with a stellar model from the PHOENIX library (thick grey line; Husser et al. 2013) at Teff = 8000 K (see Sect. 4.1).
Current usage metrics show cumulative count of Article Views (full-text article views including HTML views, PDF and ePub downloads, according to the available data) and Abstracts Views on Vision4Press platform.
Data correspond to usage on the plateform after 2015. The current usage metrics is available 48-96 hours after online publication and is updated daily on week days.
Initial download of the metrics may take a while.