Fig. 7
Download original image
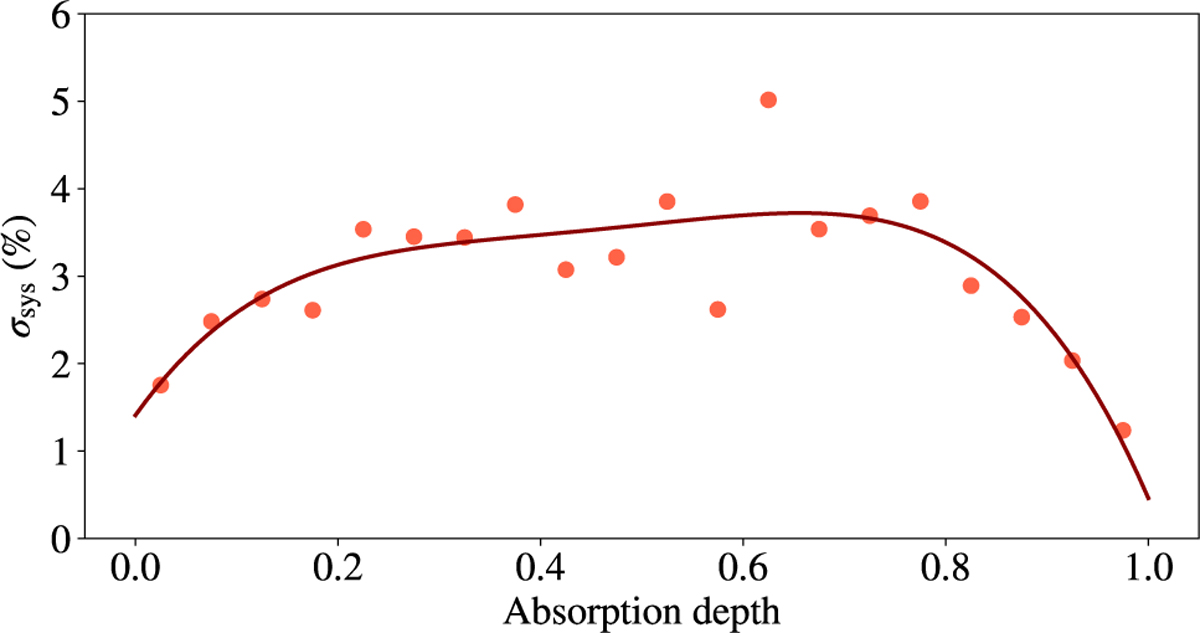
Estimation of the systematic uncertainty of our model (expressed in percentage of the reference spectrum). Dots show the measured systematic uncertainties (σsys) for pixels grouped by absorption depth. The solid line is a fit with a fourth-order polynomial, used to estimate the systematic uncertainty (σk, sys) of each pixel based on its absorption depth.
Current usage metrics show cumulative count of Article Views (full-text article views including HTML views, PDF and ePub downloads, according to the available data) and Abstracts Views on Vision4Press platform.
Data correspond to usage on the plateform after 2015. The current usage metrics is available 48-96 hours after online publication and is updated daily on week days.
Initial download of the metrics may take a while.