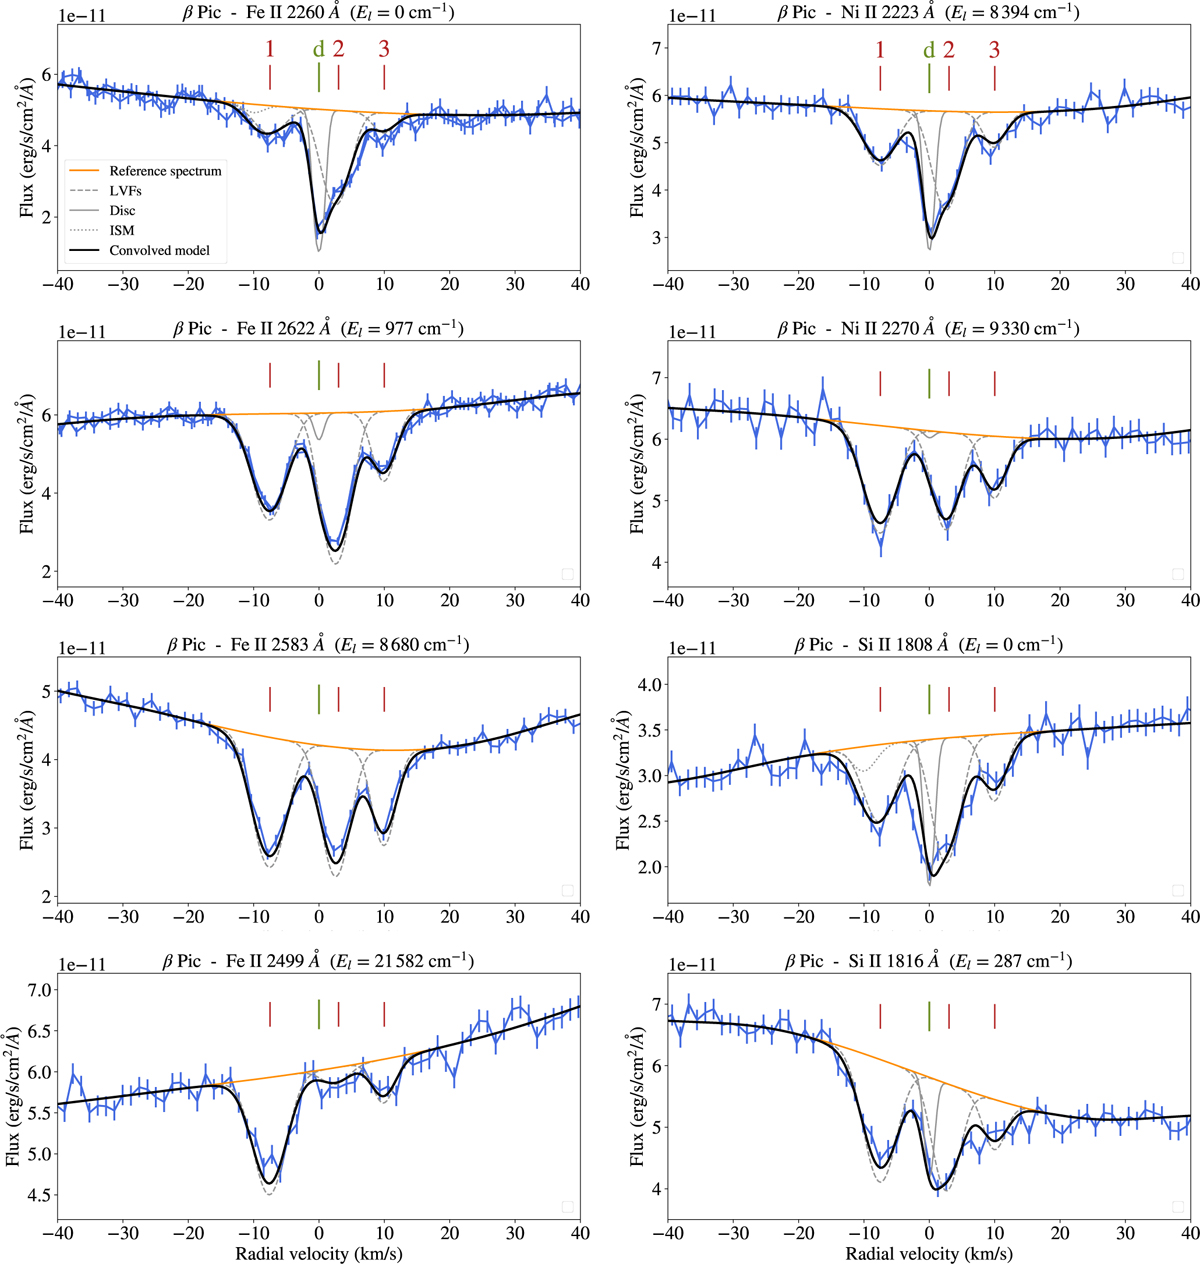
Fig. 8
Download original image
Comparison between the observed spectrum and the fitted model for Fe II, Ni II, and Si II lines. The observed spectrum is shown with a blue line; errors bars reflect the uncertainties tabulated by the STIS pipeline (see Sect. 4.8). The solid orange line shows the reference spectrum. Absorptions from the LVCs, the disc, and the ISM are shown in dashed, solid, and dotted grey lines, respectively. The full model, convolved by the STIS LSF, is shown as a solid black line. Red ticks indicate the central velocities of the three LVCs, while the green tick at 0 km/s indicates the RV of the disc.
Current usage metrics show cumulative count of Article Views (full-text article views including HTML views, PDF and ePub downloads, according to the available data) and Abstracts Views on Vision4Press platform.
Data correspond to usage on the plateform after 2015. The current usage metrics is available 48-96 hours after online publication and is updated daily on week days.
Initial download of the metrics may take a while.