Fig. 9
Download original image
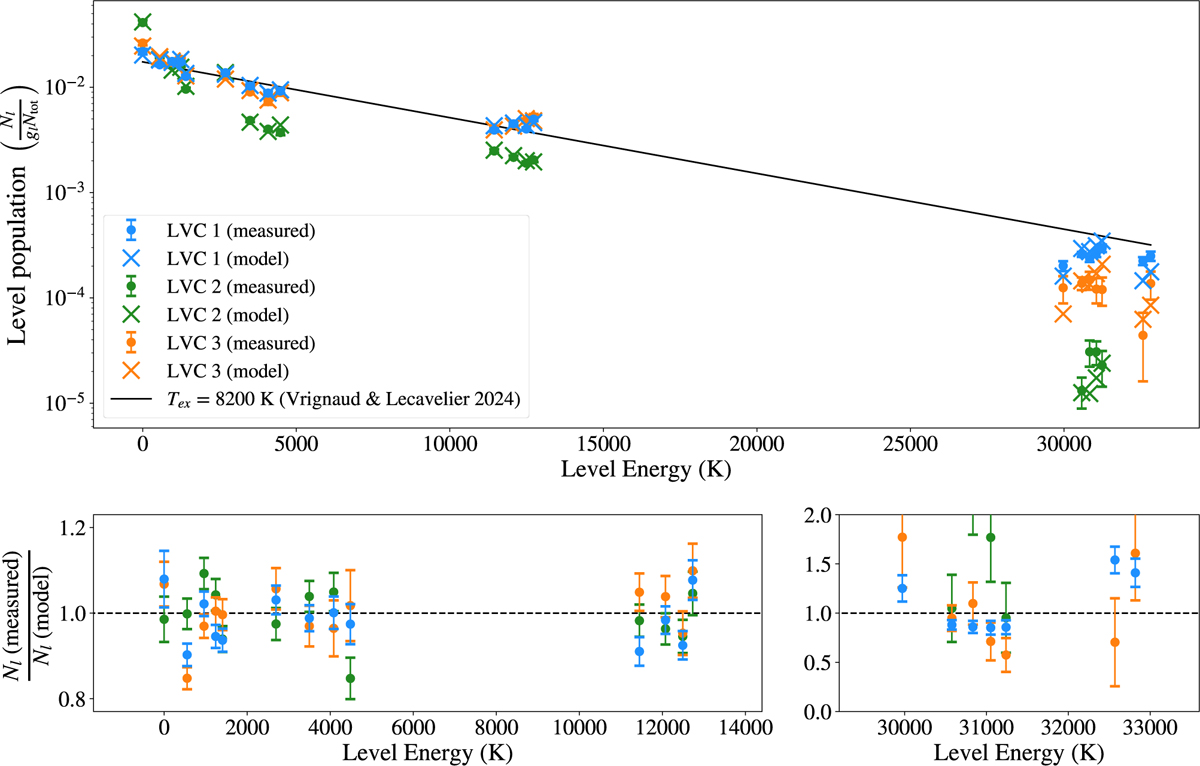
Excitation Fe II in the three LVCs. Top: comparison of the excitation diagram of Fe II measured in the three LVCs (dots with error bars) with the result from our excitation model (crosses). For clarity, we only show levels with significant detections. The solid black line indicates the excitation temperature measured by Vrignaud & Lecavelier des Etangs (2024) in a β Pic exocomet observed on December 6, 1997, and located <0.4 au from the star. By comparison, LVCs #1 and #3 (blue and orange dots) are at located at ~1 au; and LVCs #2 (green dots) is much farther away (4.7 au). Bottom: ratio of the measured and modelled abundances of the studied Fe II levels. The horizontal dotted line indicates the ratio of 1.
Current usage metrics show cumulative count of Article Views (full-text article views including HTML views, PDF and ePub downloads, according to the available data) and Abstracts Views on Vision4Press platform.
Data correspond to usage on the plateform after 2015. The current usage metrics is available 48-96 hours after online publication and is updated daily on week days.
Initial download of the metrics may take a while.