Fig. 1.
Download original image
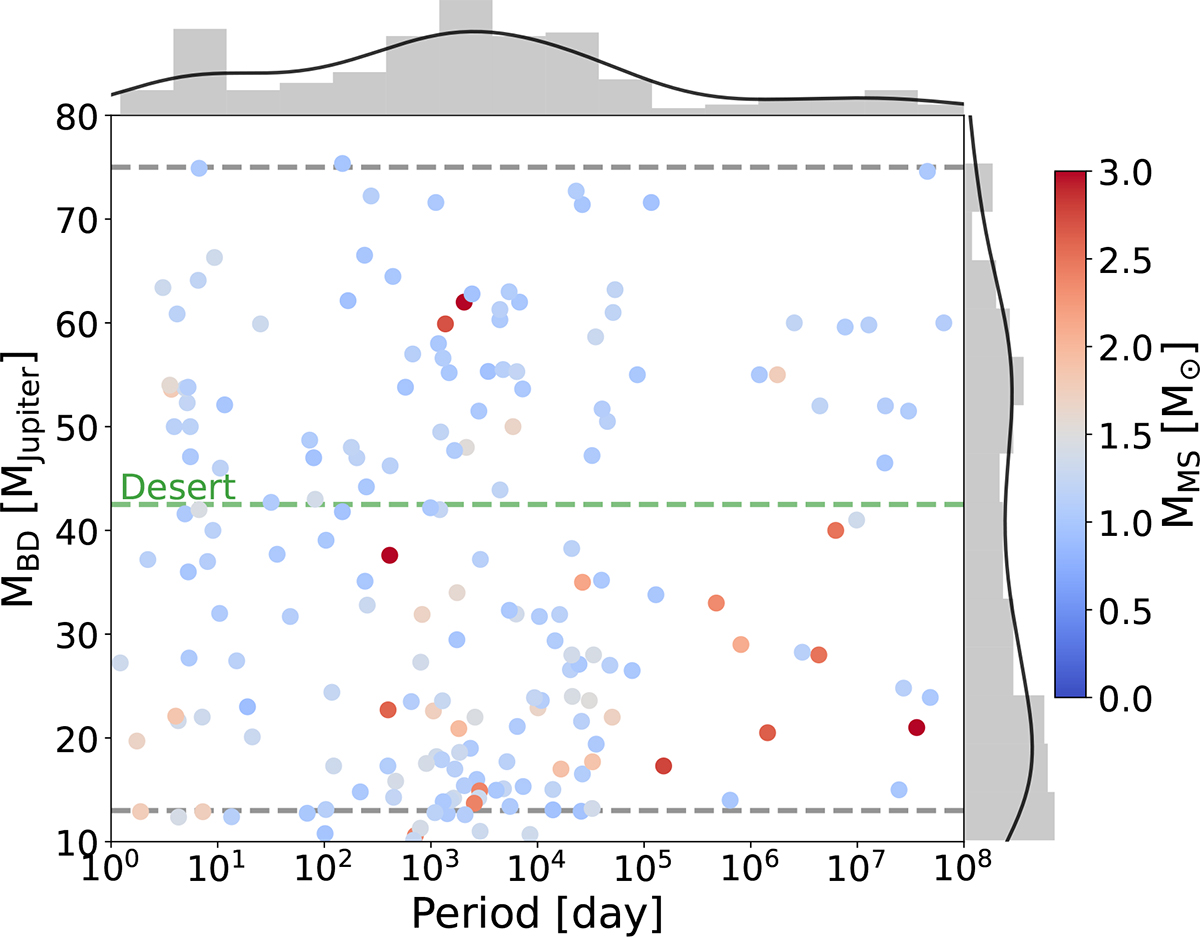
Mass–period distribution of observed MS–BD binary systems used in this study. The colour scale indicates the mass of the host MS star. The top and right histograms, with kernel density estimates (KDEs), show the distributions of the orbital period and BD mass, respectively. The dashed grey lines indicate the BD mass range, while the dashed green line marks the BD desert transition mass of 42.5 MJup from Ma & Ge (2014).
Current usage metrics show cumulative count of Article Views (full-text article views including HTML views, PDF and ePub downloads, according to the available data) and Abstracts Views on Vision4Press platform.
Data correspond to usage on the plateform after 2015. The current usage metrics is available 48-96 hours after online publication and is updated daily on week days.
Initial download of the metrics may take a while.