Fig. 11.
Download original image
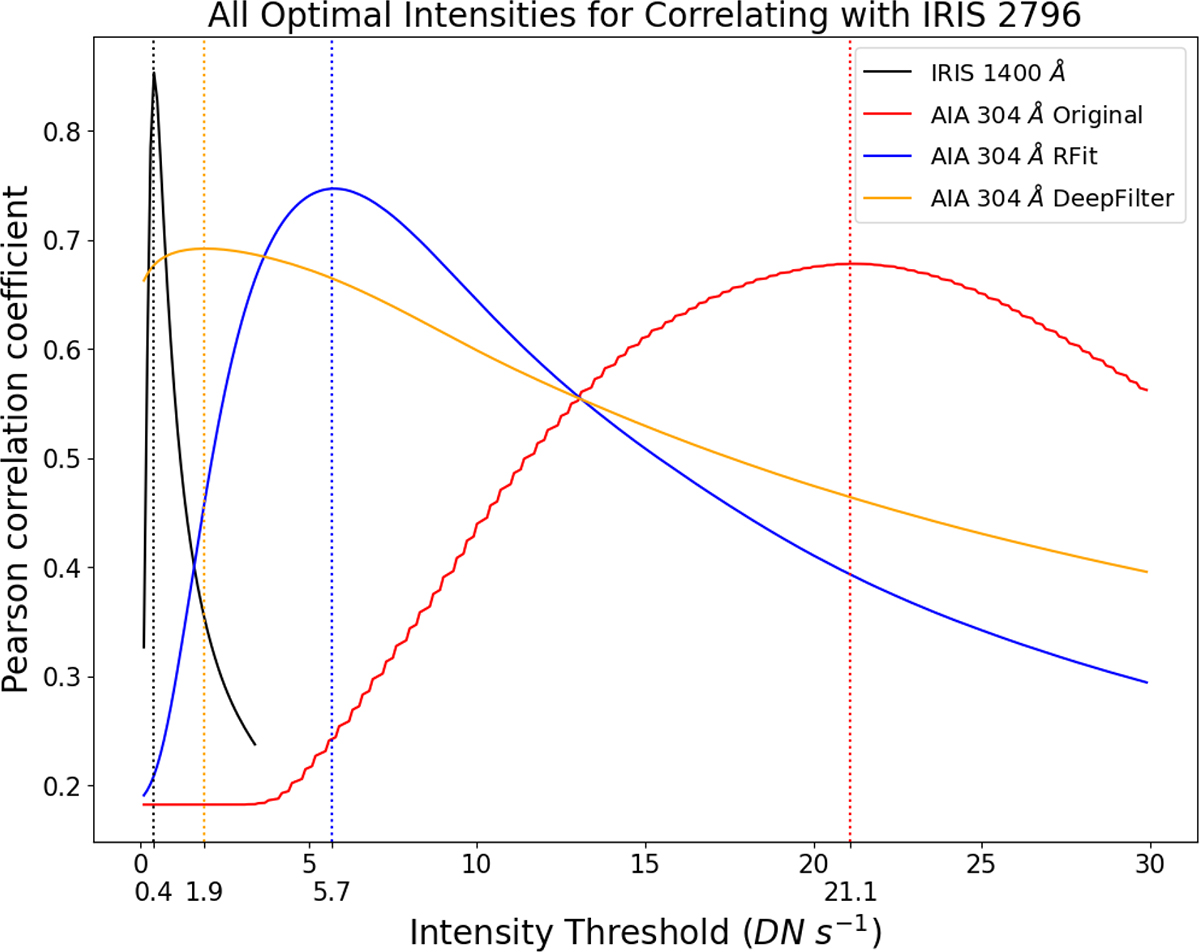
Figure showing how the optimal threshold for each image type was found. Each image type (IRIS 1400, Original AIA 304 Å RFit AIA 304 Å Deep Filter AIA 304 Å) is binarised at a range of intensity thresholds between 0.1 and 30 DN s−1. For each 0.1 DN s−1 step in this range, the binarised images are correlated with the pre-binarised IRIS 2796 images for the entirety of the evaluation dataset. The resulting correlation coefficients are calculated and then plotted. The threshold for each image type can then be found and are indicated by the dotted lines in the figure.
Current usage metrics show cumulative count of Article Views (full-text article views including HTML views, PDF and ePub downloads, according to the available data) and Abstracts Views on Vision4Press platform.
Data correspond to usage on the plateform after 2015. The current usage metrics is available 48-96 hours after online publication and is updated daily on week days.
Initial download of the metrics may take a while.