Open Access
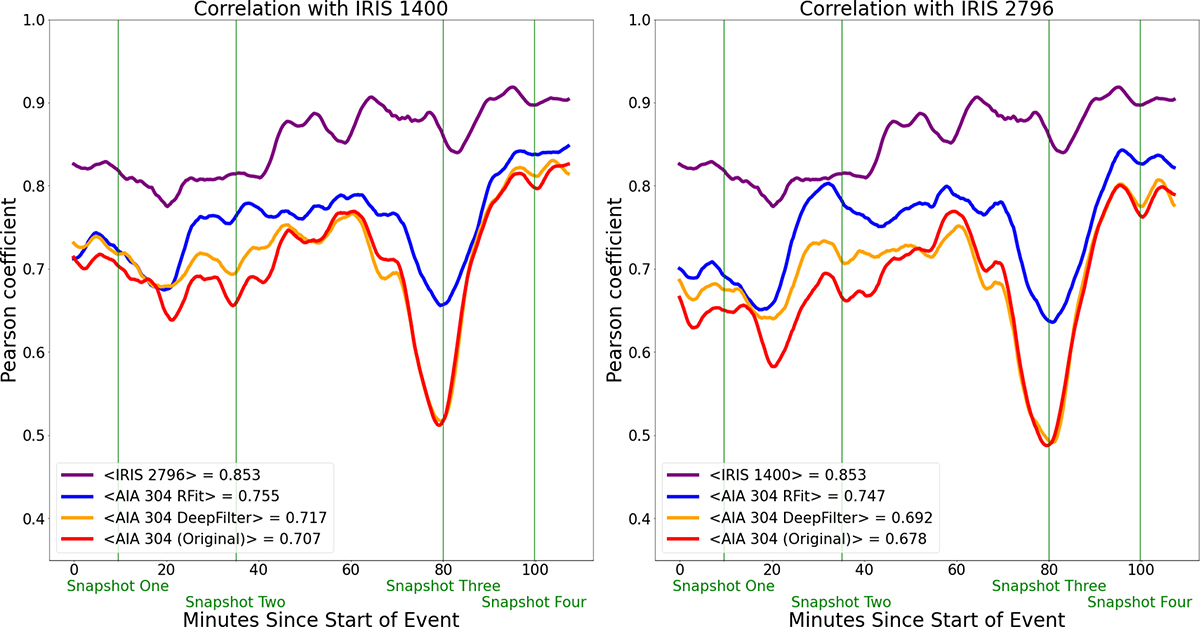
Fig. 16.
Download original image
Correlation plots showing the Pearson correlation coefficients between the various binarised AIA-based images and the IRIS-based images (left: IRIS 1400 Å; right: IRIS 2796 Å). The average Pearson correlation coefficient is shown in the bottom left of each graph.
Current usage metrics show cumulative count of Article Views (full-text article views including HTML views, PDF and ePub downloads, according to the available data) and Abstracts Views on Vision4Press platform.
Data correspond to usage on the plateform after 2015. The current usage metrics is available 48-96 hours after online publication and is updated daily on week days.
Initial download of the metrics may take a while.