Fig. 2.
Download original image
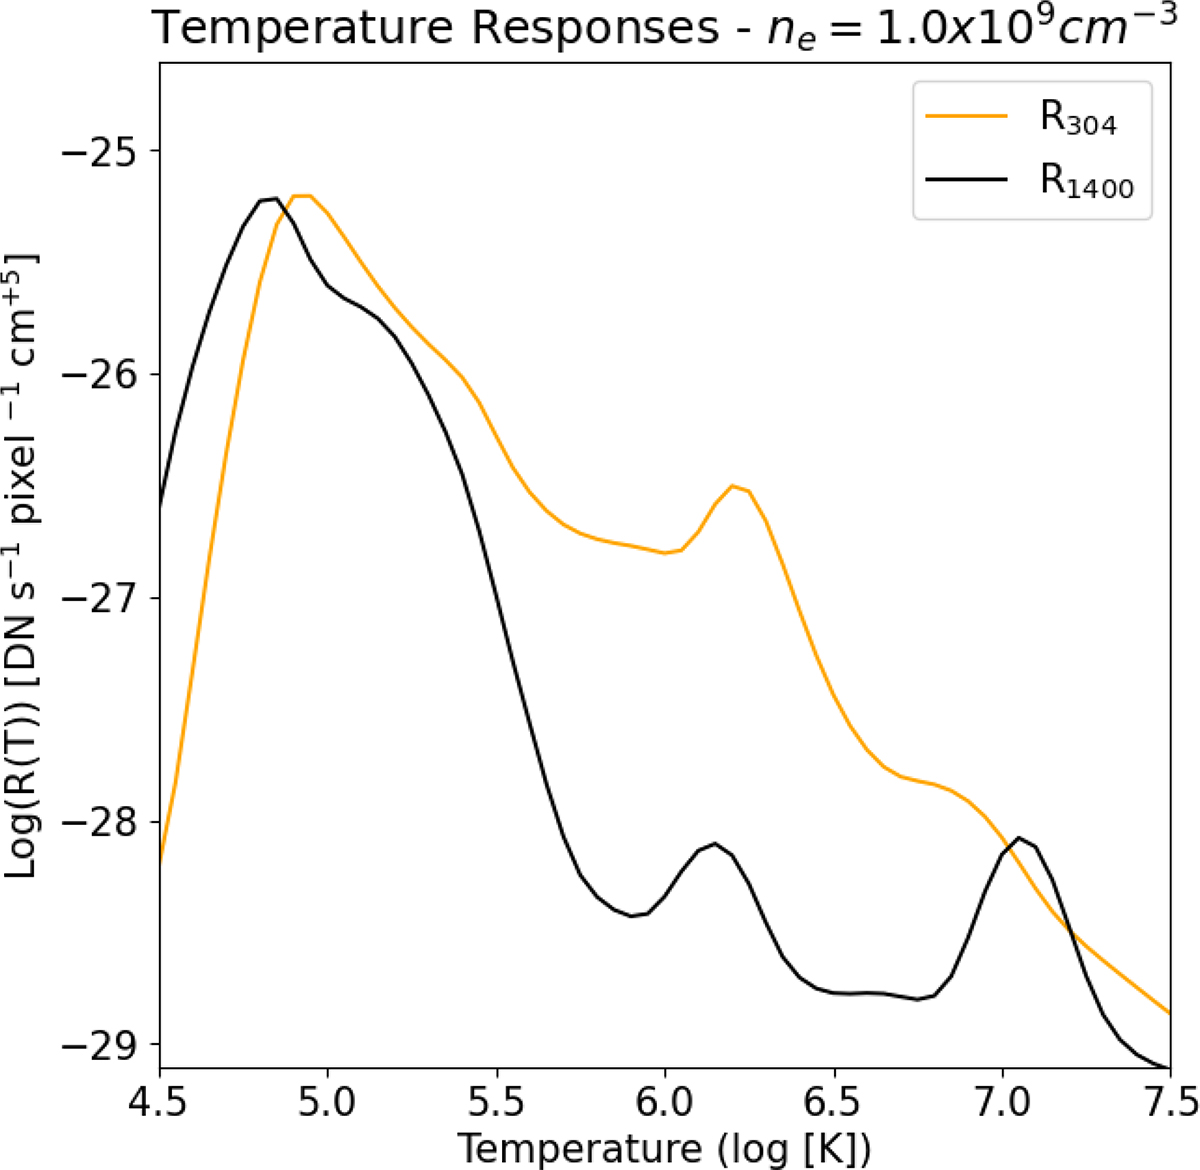
Temperature response functions for the AIA 304 Å and IRIS 1400 Å channels. It is worth noting that the response function was calculated based on the CHIANTI database, which has been known to fail at reproducing the He II intensity peak between 104.8–104.9 K, where the resulting peak is an order of magnitude lower. This is likely due to the effects of non-equilibrium ionisation in tandem with optically thick radiative transfer in the He II line causing these large intensities (Golding et al. 2017). To account for this, the AIA 304 Å response function has been multiplied by an empirical factor of 5 (O’Dwyer et al. 2010).
Current usage metrics show cumulative count of Article Views (full-text article views including HTML views, PDF and ePub downloads, according to the available data) and Abstracts Views on Vision4Press platform.
Data correspond to usage on the plateform after 2015. The current usage metrics is available 48-96 hours after online publication and is updated daily on week days.
Initial download of the metrics may take a while.