Open Access
Fig. 13
Download original image
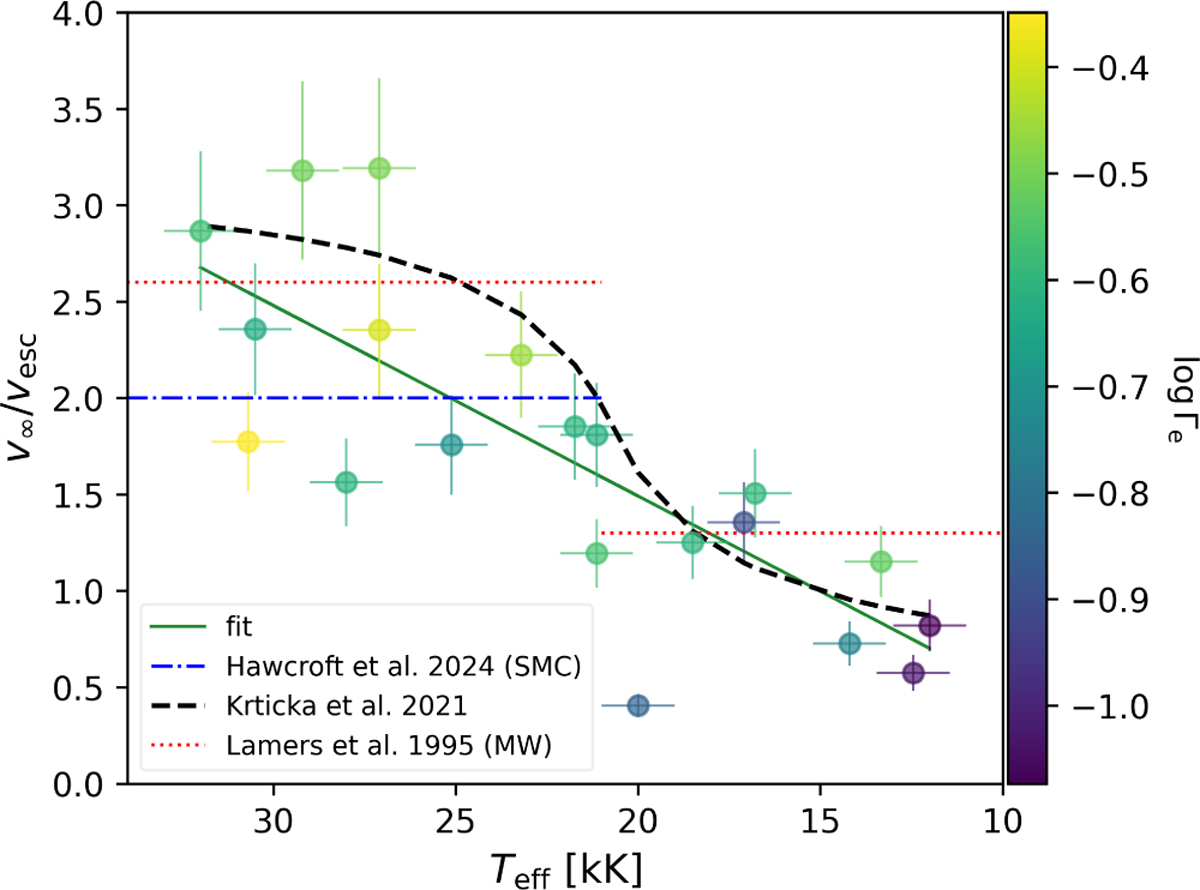
Ratio (v∞/vesc) as a function of temperature. The solid green line represents the linear fit to our sample. The dashed black line is the relation presented in Krtička et al. (2021). The dotted red lines represent the ratios from Lamers et al. (1995). The colour gradient correlates with the value of Γe.
Current usage metrics show cumulative count of Article Views (full-text article views including HTML views, PDF and ePub downloads, according to the available data) and Abstracts Views on Vision4Press platform.
Data correspond to usage on the plateform after 2015. The current usage metrics is available 48-96 hours after online publication and is updated daily on week days.
Initial download of the metrics may take a while.